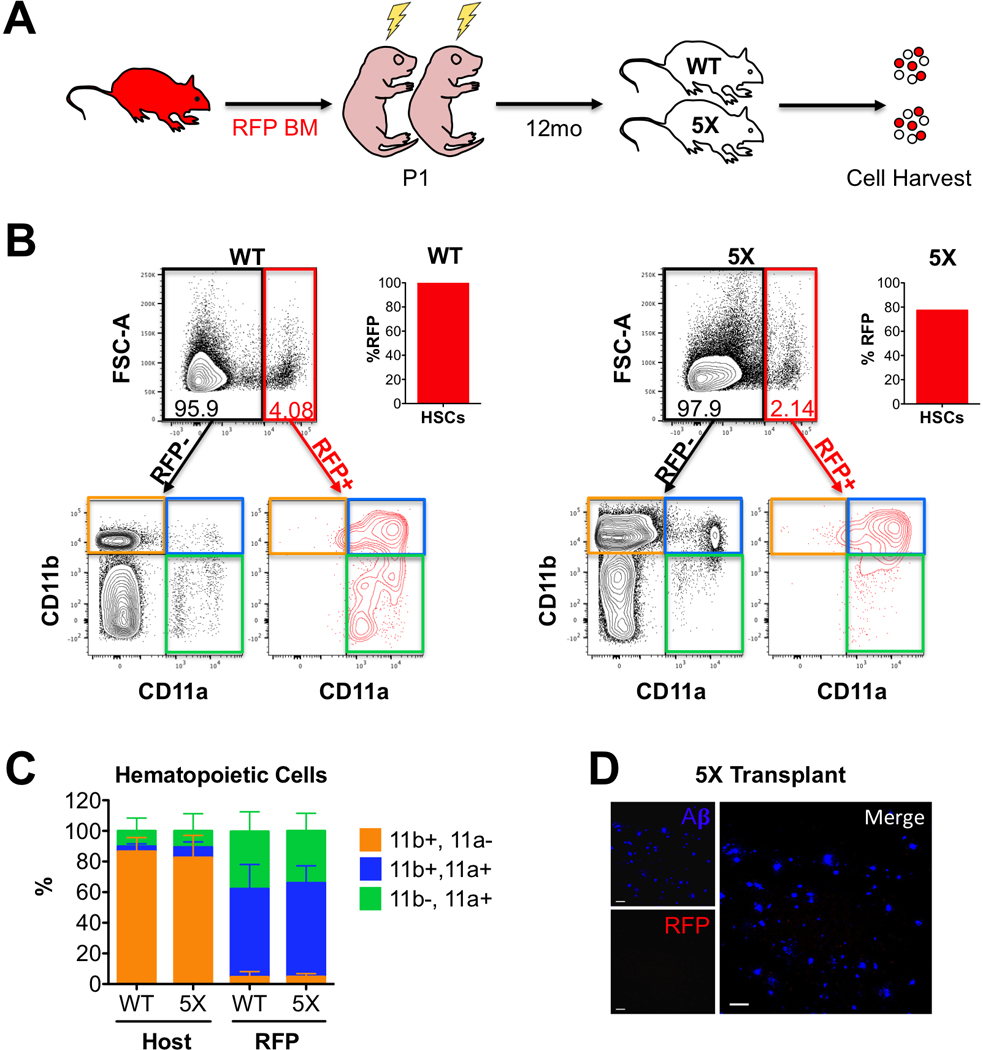
Figure 4: Plaque-associated myeloid cells are not derived from bone marrow.

(A) 5xFAD−/− (WT, n=4) and 5xFAD+/− (5X, n=4) littermates were transplanted with RFP+ bone marrow as neonates (P1), then analyzed 12 months later. (B) Representative flow cytometry plots of WT (left) and 5X (right) brains at 12 months of age. Total RFP- (black gate) and RFP+ (red gate) cells were analyzed for CD11b vs. CD11a expression (lower FACS plots). The bar graph (right) indicates the donor HSC chimerism in the BM of the transplanted mice at 12 months. The bottom CD11b versus CD11a plots show the distribution of immune populations in the RFP- host cells (left, black) and RFP+ BM-derived cells (right, red). Quadrants Q1 (CD11b+ CD11a-, orange quadrant) represent microglia, Q2 (CD11b+ CD11a+, blue quadrant) macrophages, and Q3 (CD11b- CD11a+, green quadrant) lymphocytes. (C) Bar graph showing the distribution of immune cell types in the host (left bars) and RFP+ donor (right bars) in WT and 5X brains. The sum of the three immune cell quadrants was set to 100%. Error bars are S.D. (N=4 mice each). (D) Representative image of the brain of a 5X mouse transplanted with RFP+ BM 12 months post-transplant show no infiltrating RFP+ cells (red). Aß plaques are shown in blue. Images taken at 20X magnification, scale bars = 50μm.
