
Figure 5: Fluorescence-Assisted Quantification Technique (FAQT).
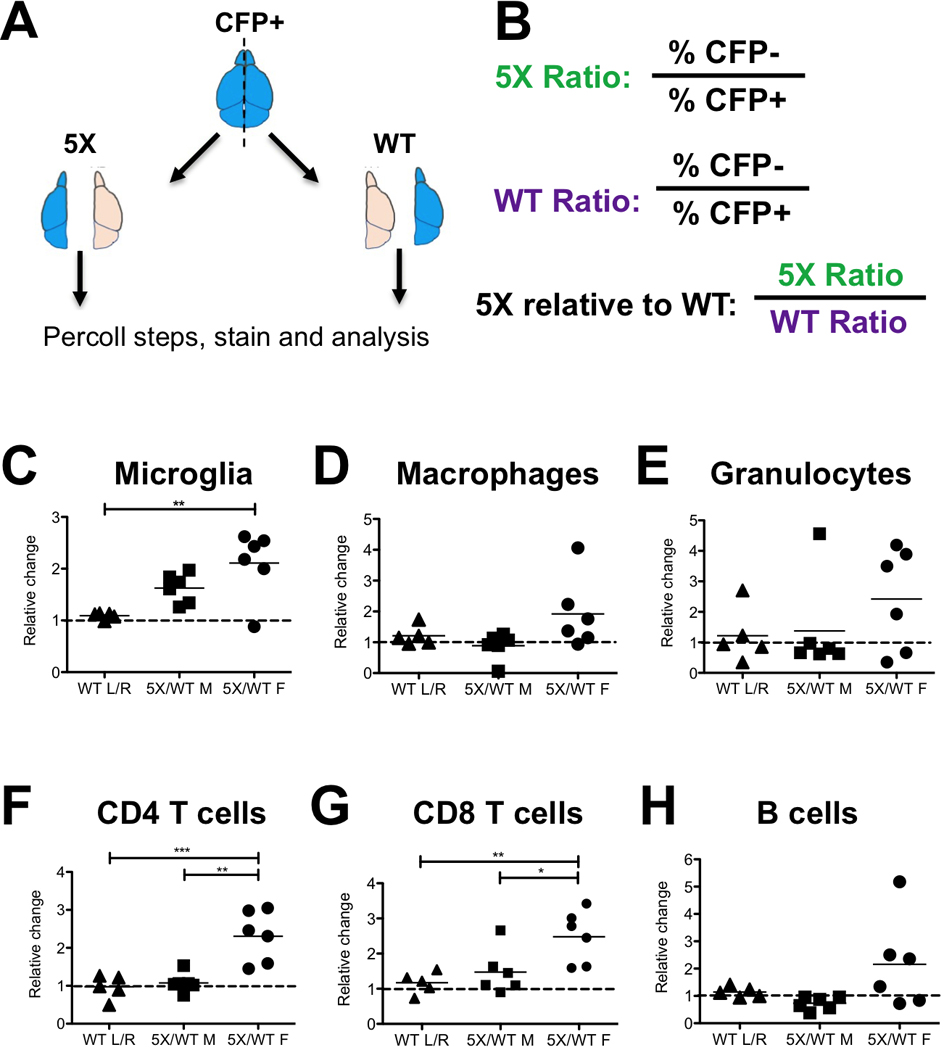
(A) Schematic of FAQT. Fluorescent brains (e.g. CFP) are divided into lobes and mixed with one lobe from a 5X mouse and one lobe of a WT littermate, then processed and analyzed by flow cytometry. After FACS analysis, immune cell populations were each gated and then separated into CFP+ and CFP- fractions. See gating strategy for each immune cell type in Figure S5.(B) Quantification strategy. The ratio of CFP- to CFP+ cells was calculated for both the 5X and WT pair, then was used to calculate the ratio of 5X to WT cells (5X:WT), canceling out the CFP+ spiking cells. (C-H) For each immune cell population, the leftmost column shows the relative ratio of immune cells between the left and right lobes of a WT brain (WT L/R), which represents the WT lobe-to-lobe control. The 5X:WT ratio of each pair of 5X/WT lobes is plotted, showing male pairs (middle) and female pairs (right). The value is the ratio of 5X immune cells relative to WT (which is set to one and indicated by the dashed line). Statistical analysis (one-way ANOVA, Tukey’s multiple comparison test) compares the three groups. Asterisks represent a p-value of <0.05.