
Figure 1. Serum Urate and Iohexol-based Glomerular Filtration Rate (GFR) Trajectories.
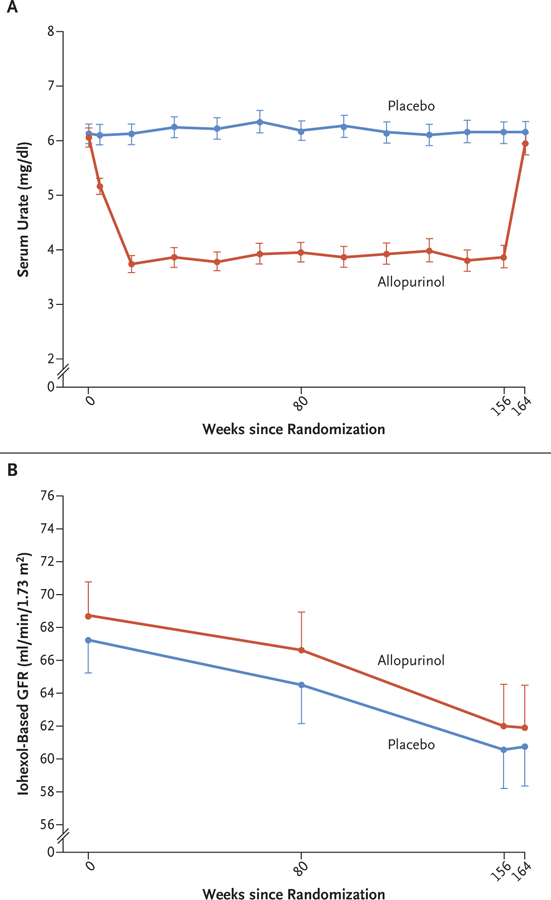
The mean levels of serum urate (Panel A) and the mean iohexol-based GFR (Panel B) in the two groups are shown at different time points during the trial. I bars indicate 95% confidence intervals. The mean serum urate values are shown for participants with available levels at each time point. The mean iohexol-based GFR values are shown for the entire intention-to-treat population, with missing values imputed as described in the Methods section. The intervention period ended at week 156 after randomization, and the 2-month washout period ended at week 164. To convert the values for serum urate to micromoles per liter, multiply by 59.48.