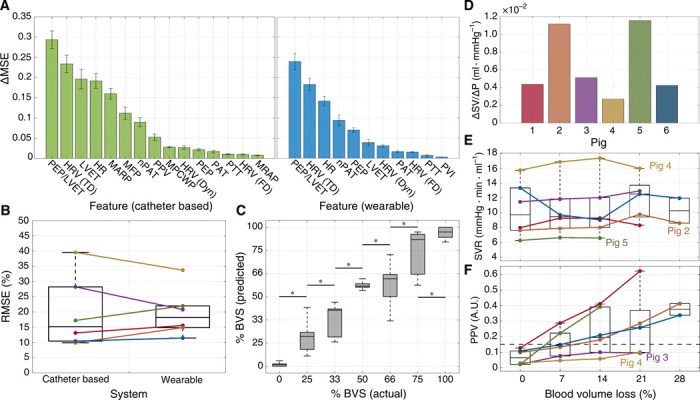
Fig. 4. Analysis of physiological features during exsanguination.

(A) Feature importance for catheter-based (green) and wearable (blue) systems during random forest regression. SD error bars are shown. (B) RMSE between ground truth and estimated BVS using random forest regression (from Fig. 3). Colors for all figures correspond to the labeling in (D). (C) Actual versus predicted BVS aggregated across all animal subjects for the wearable system. Boxes denote the 25th to 75th percentile range, and whiskers denote the 5th to 95th percentiles. Asterisks indicate significant separation (P < 0.05) between the levels as determined by a Mann-Whitney U test. (D) Slope of linear fit between stroke volume (SV) and preload. (E) Average systemic vascular resistance (SVR) computed at each level of BVL. (F) Average PPV computed at each level of BVL. A reference line at 0.15 is overlaid (black, dashed). MSE, mean square error.
