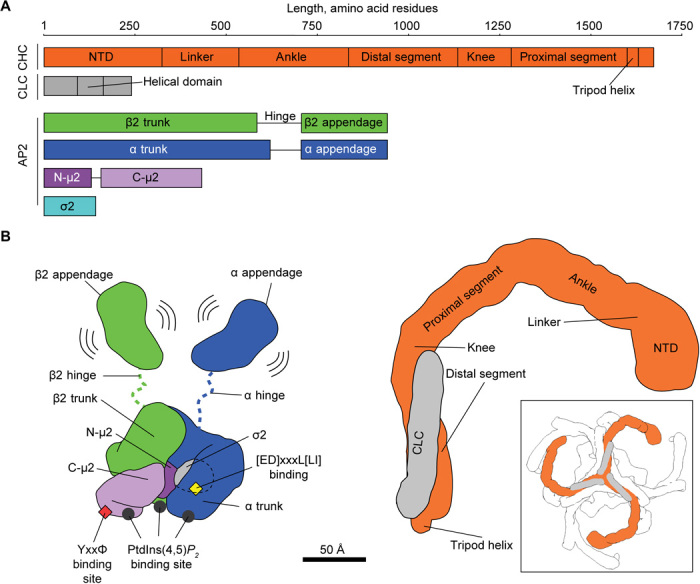
Fig. 1. Overview of AP2 and clathrin structures.

(A) Schematic representation of AP2 and clathrin polypeptide chains with marked domains. A length ruler (in amino acid residues) is given at the top. Note that the FLAP AP2 construct lacks α hinge and appendage regions, while the Core AP2 construct lacks α and β2 hinge and appendage regions. (B) Cartoon representation of the structures of AP2 (left) and clathrin (right). Subunits are color-coded as in (A) and known functional sites and domains are marked. The boxed panel shows a zoomed-out view of a clathrin triskelion with neighboring triskelia in white.
