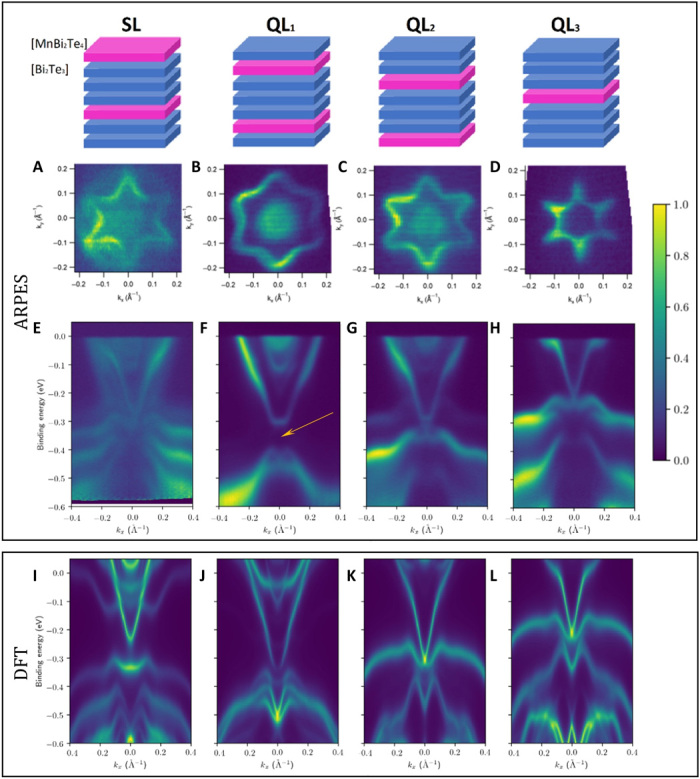
Fig. 6. The comparison of ARPES data and DFT calculation on MnBi8Te13.

(A to D) Experimental ARPES isoenergy surfaces at the Fermi level measured with 26 eV, 20 μm×50 μm spot-sized linear horizontal light at 12 K: (A) SL, (B) QL1, (C) QL2, and (D) QL3 termination. All Fermi surfaces show the expected sixfold symmetry with clear distinctions. (E to H) Experimental ARPES E-k spectrum cut along the M → Γ → M high symmetry direction for various terminations. A large and clean gap in the surface states of the QL1 termination is observed in (F), as highlighted by the arrow that points to the charge neutrality point suggested by DFT calculations. (I to L) Calculated DFT E-k spectrum cut along the M → Γ → M high symmetry direction for various terminations. We shift the Fermi level to match the experimentally observed Fermi level for each termination.
