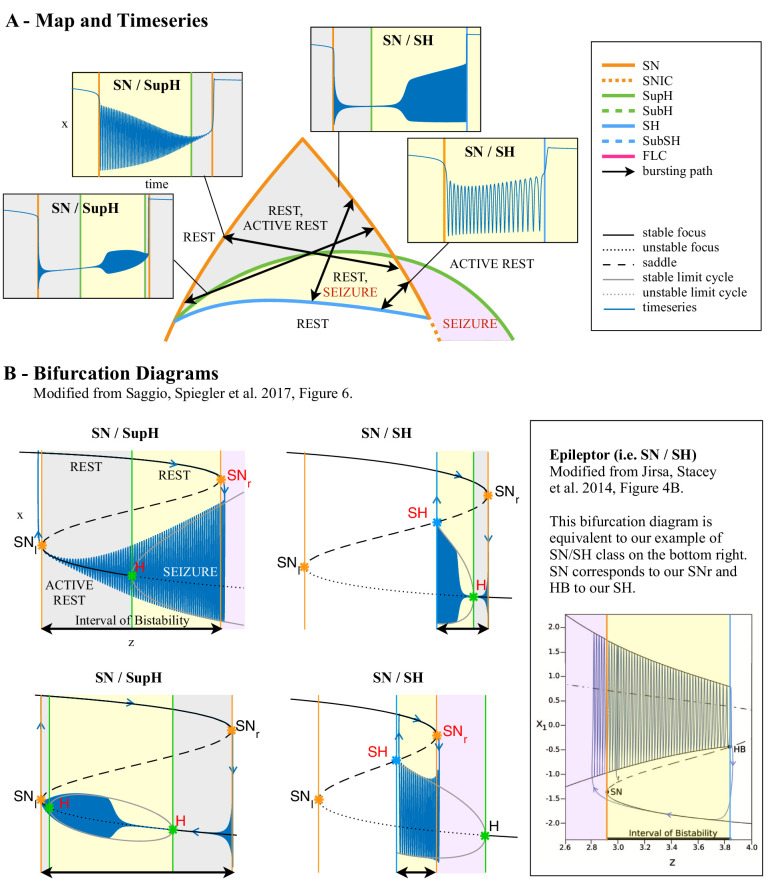
Appendix 1—figure 11. Dynamotypes with baseline shift.
(A) Zoom of the bistability region in the upper part of Figure 4C. In this region, the dynamotypes are combinations of SN, SupH, and SH. All begin with a SN bifurcation, which causes a baseline shift. The background of the timeseries is shaded with the same color of the portion the map traversed. Vertical colored lines mark the value of z at which bifurcations on the map are crossed. Two of the trajectories (top right, bottom left) do not have sustained oscillations until after crossing the SupH bifurcation a short time after the SN onset. (B) Bifurcation diagrams for the same types. Onset and offset bifurcations for the oscillatory phase are marked with red letters. SNr refers to the SN curve on the right of the map, SNl to the SN at the left. Inset: comparison with the ‘Epileptor’ type from Jirsa et al., 2014.

