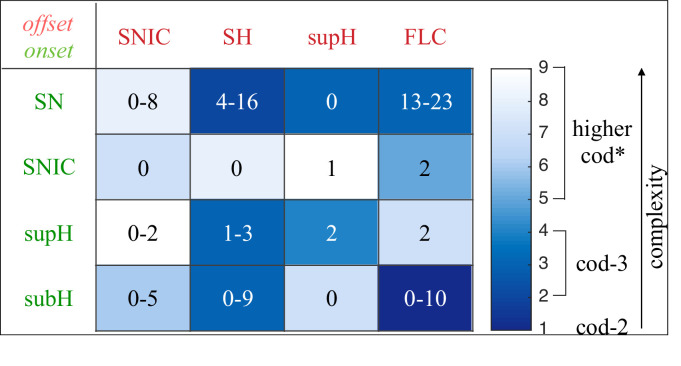
Appendix 1—figure 13. Complexity of types and data classification results.
The complexity of the 16 dynamotypes is shown, with darker colors being the least complex. Superimposed on that are the number of seizures from Figure 2E–F in each type. Note that some of the seizures could not be distinguished between SH and SNIC offsets, or between SN (-DC) and SubH, so for these types there is a range. *-The codimension of some of these types is presumed, see Saggio et al., 2017 for details.

