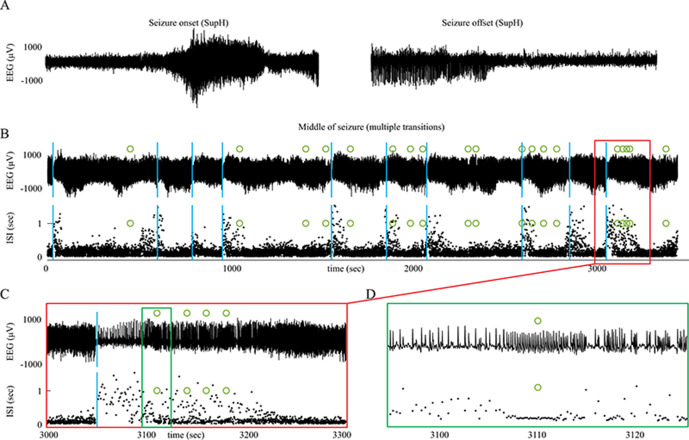
Appendix 1—figure 16. Status Epilepticus patient 2.
(A) Onset and offset of a seizure lasting 5 hr were both SupH bifurcations. (B) During the seizure, there were many transitions in which the dynamics altered. Top: voltage trace. Bottom: interspike intervals (ISI) show multiple periods in which nearly-constant ISI is interrupted by disorganized firing. Blue lines indicate these transition periods. (C) Expanded view of red box in B. (D) Expanded view of green box in C. Green circles indicate runs of highly periodic, 7 Hz spike waves, which became more frequent later in seizure.

