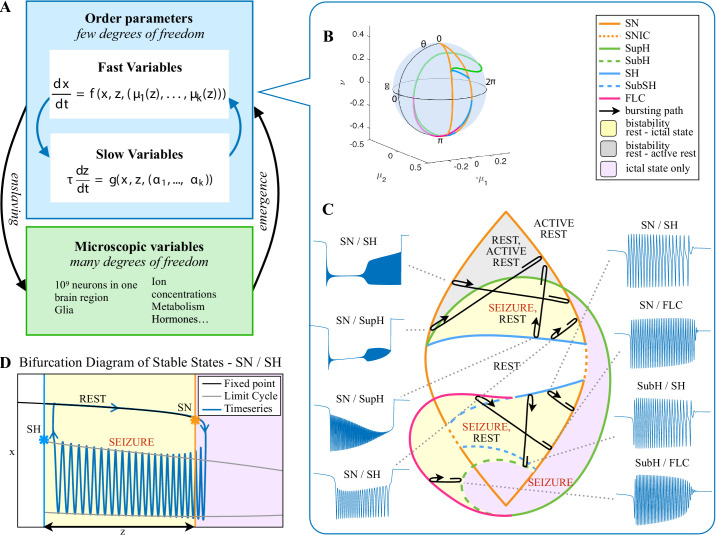
Figure 4. Modeling seizures.
(A) During a seizure the microscopic variables, which compose a brain region, organize so that the emergent global activity can be described by a few collective variables. These collective variables, on the other hand, act on the microscopic variables, ‘enslaving’ them. (B) The fast variables can be in different states depending on the values of the parameters. In our model, we have three parameters ; however, the relevant dynamics occurs on a sphere with fixed radius. We thus consider the two-parameter spherical surface that can be sketched with a flat map as shown in C. (C) Bifurcation curves divide the map in regions where different states are possible: healthy state (white), ictal state (violet), coexistence between healthy and ictal states (yellow), coexistence between healthy and ‘active’ rest (a non-oscillatory state with a different baseline than the healthy state (gray)). When a seizure starts because the system crosses an onset bifurcation, the slow variable enables movement along the black arrow (a path in the map) to bring the system back to rest. Note that in this model, the system alternates between the resting and seizing states within the bistability regions. The shape of the arrow is meant to better show the trajectory followed by the system, however movement in the model occurs back and forth along the same curve. Insets show example of timeseries for different paths. SubSH: Subcritical Saddle Homoclinic, an unstable limit cycle that occupies a small portion of the map but is incapable of starting/stopping seizures, and thus is not included in Figure 1 nor the rest of the analysis. (D) An expanded view of one trajectory followed in C. The path (double arrow) represents movement from resting to seizure state and back by crossing the bifurcations, which in this case are SN and SH. This activity forms a seizure in the time series. The resting state is represented by a black line (fixed point), the minimum and maximum of the amplitude of the seizure (limit cycle) by gray lines.

