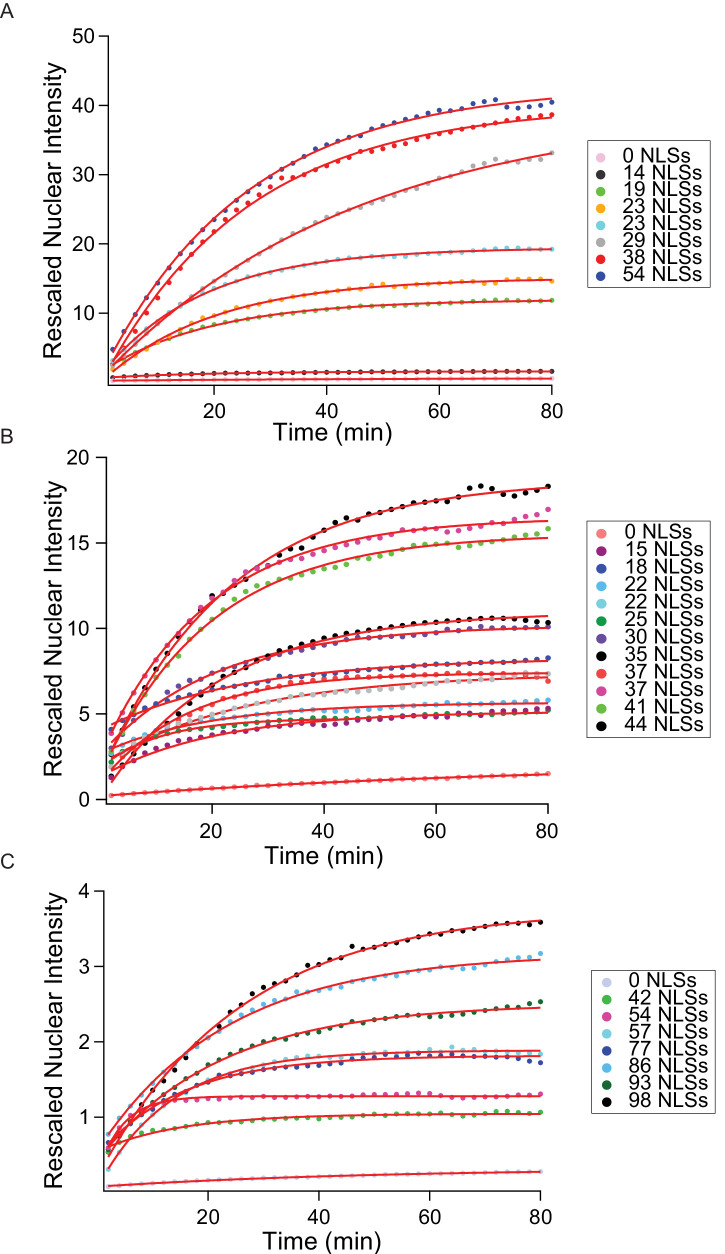
Figure 3. The import kinetics of large cargoes is tuned by the NLS number.
(A) Confocal images of nuclear import of the different large cargoes. Cells were incubated for up to 1.5 hr with capsids tagged with different number of NLS peptides on their surface. All cargoes displayed a distinct NLS-dependent behaviour. The scale bar corresponds to 20 μm. (B) Representative nuclear import traces for the three large cargoes labelled with increasing amount of NLS peptides. The corrected nuclear intensities are obtained by background-subtracting the raw nuclear intensities, scaling them according to capsid brightness (#dyes) estimated from FCS (Table 1) and subtracting the initial offset determined by the mono-exponential fit, to better compare the import efficiencies. The corrected intensities are proportional to capsid concentration and allow us to compare the import efficiency of the different samples. See Figure 3—figure supplement 1 for the full dataset displayed without offsetting by and overlaid with mono-exponential fits.


