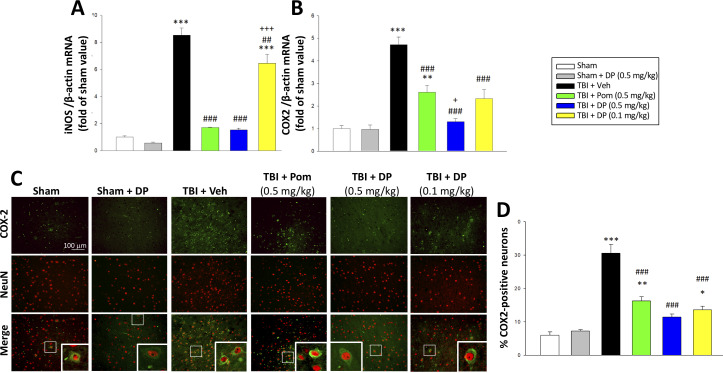
Figure 11. TBI-induced elevations in mRNA expression levels of iNOS and COX2, as well as of COX2 protein expressing neurons, which were largely reversed by post-injury treatment with DP or Pom.
TBI induced a significant increase in mRNA levels of (A) iNOS, and (B) COX2, markers of inflammation. DP and Pom mitigated these elevations in iNO2 and COX2. Mean ± S.E.M. (n = 5 in each group). **p<0.01, ***p<0.001 vs. the sham group. ##p<0.01, ###p<0.001 compared with the TBI + Veh group. +p<0.05, +++p<0.001 vs. the TBI + Pom group. (C) The immunofluorescence of COX-2 and NeuN protein was evaluated in ipsilateral cortical brain tissue across groups and is shown in representative photomicrographs. COX-2 immunoreactivity is shown in green, and NeuN (a marker for neurons) is shown in red. Colocalization is indicated by yellow. (D) TBI induced a significant increase in the fraction of neurons expressing COX2, which was significantly attenuated by DP and Pom. There was a significant decrease in the number of COX-2 positive neurons in TBI + DP group. Mean ± S.E.M. (n = 4 in each group). *p<0.05, **p<0.01, ***p<0.001 vs. the sham group. ###p<0.001 vs. the TBI + Veh group. Scale bar (B) = 100 μm.

