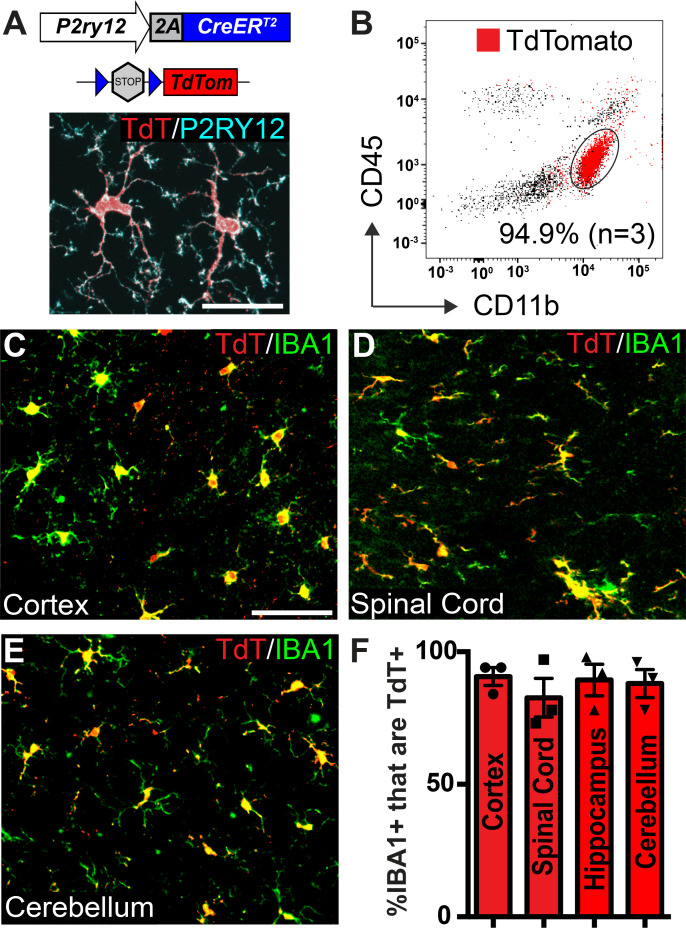
Figure 1. Microglia recombination by P2ry12-CreER.
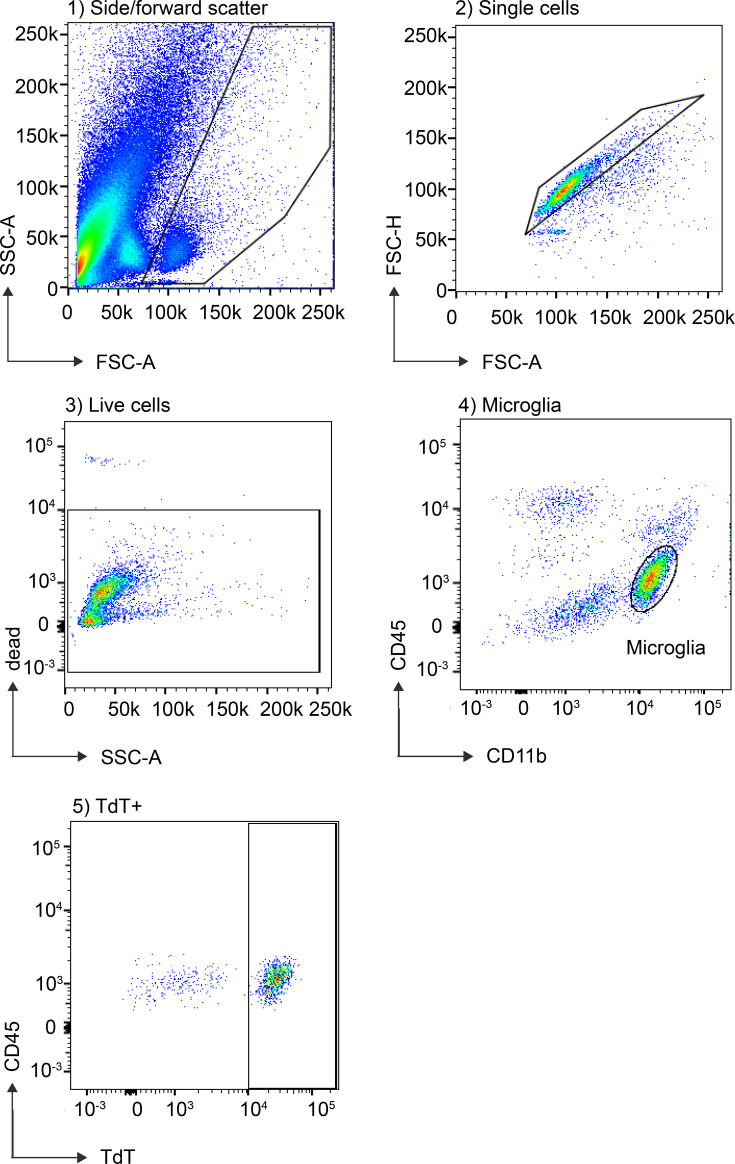
(A) Design of the P2ry12 knock-in allele and a P2ry12-CreER;Rosa26Ai14 mouse brain section immunostained for P2RY12 (cyan) and TdTomato (red). (B) Flow cytometry analysis of recombined TdTomato+ microglia in a P2ry12-CreER;Rosa26Ai14 mouse. Microglia were pre-gated on forward scatter, isolation of single cells, and removal of dead cells. TdTomato+ cells are marked in red. 94.9 ± 2.75% of microglia (CD11b+CD45int cells) were recombined by P2ry12-CreER. (C-E) Images of recombination in microglia of the cerebral cortex (C), spinal cord (D) cerebellum (E) in P2ry12-CreER; Rosa26Ai14 mice. Sections stained with pan-macrophage marker IBA1 (green). (F) Immunohistochemical quantification of recombination in the cerebral cortex, spinal cord, hippocampus and cerebellum. For B-E, n = 3 mice. Error bars in F = standard error of the mean (SEM). Scale bars = 20 µm (A), 50 µm (C).


