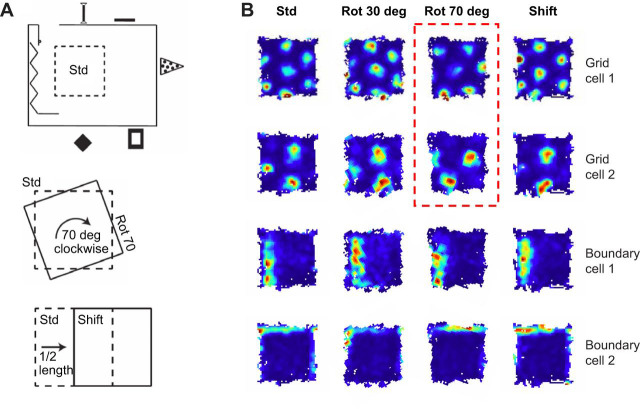
Fig. 2.
Grid and boundary cells in affine transformations (I). (A) Schematic of an experimental apparatus in which rats foraged on a 1.4×1.4 m platform [standard (Std)] placed in a room enriched with remote visual cues (top). This platform was rotated (Rot)/shifted (Shift) between recording sessions (center and bottom). (B) Example of two grid cells of different scale and two boundary cells that were recorded simultaneously across consecutive manipulations. The color code in each rate map represents the average firing rate of the cell in each position on the platform (red: high firing rate; blue: lack of activity). The rate maps have been rotated to a common orientation so as to aid visual comparison. The geometric relationships between each grid pattern and the boundaries (as well as the firing fields of the boundary cells) remain constant across most manipulations, consistent with the idea that boundary cells can predictably anchor the grid representation to an allocentric reference frame. However, in some cases, these relationships can be reconfigured because the grids drifted relative to the platform reference frame (marked by dashed red lines) while controlled by distal cues (not illustrated). Adapted from Savelli et al. (2017).

