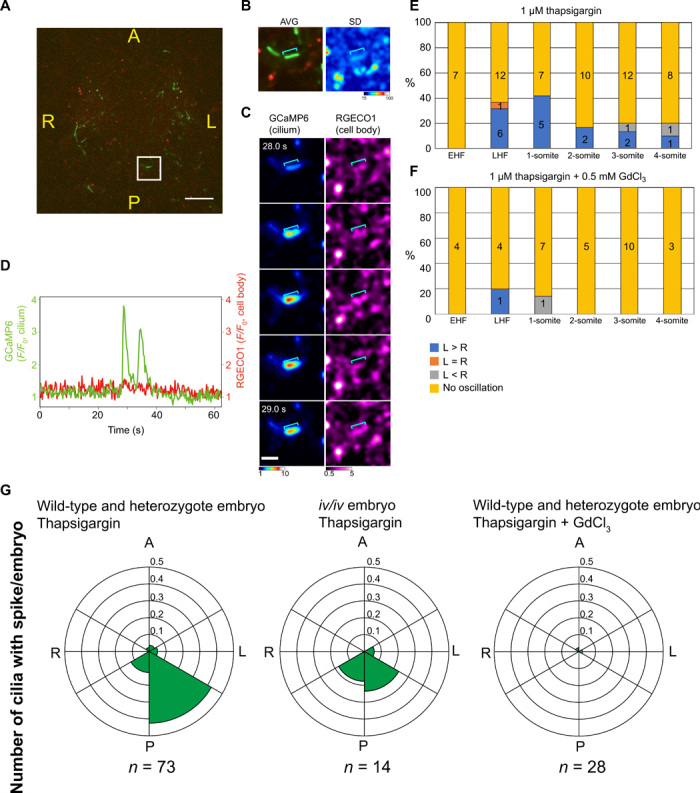
Fig. 5. Localization of cilia showing thapsigargin-resistant Ca2+ transients to the left posterior region of the node.

(A) Image of ciliary 5HT6-GCaMP6 (green) and cytoplasmic RGECO1 (red) in the node region of a wild-type mouse embryo at the late headfold stage treated with 1 μM thapsigargin. The cell within the boxed region was analyzed in (B) to (D). Scale bar, 20 μm. (B) Time-averaged fluorescence image (AVG) and SD of RGECO1 fluorescence intensity for the cell analyzed in (C) and (D). The blue line indicates the cilium. (C) Images of ciliary and cytoplasmic Ca2+ concentrations in a thapsigargin-treated embryo. Scale bar, 5 μm. (D) Time course of ciliary and cytoplasmic Ca2+ concentrations in the thapsigargin-treated embryo. (E and F) Percentage of embryos showing ciliary Ca2+ spikes at the indicated developmental stages, treated with either 1 μM thapsigargin (E) or 1 μM thapsigargin plus 0.5 mM GdCl3 (F). The L-R distribution of the Ca2+ spikes and the numbers of embryos studied are also indicated. EHF and LHF, early and late headfold stages, respectively. (G) Circular plots of the number of cilia showing Ca2+ transients/embryo in control (wild type and heterozygous) or iv/iv embryos at the late headfold to three-somite stage exposed to 1 μM thapsigargin with or without 0.5 mM GdCl3. The number of embryos examined (n) is indicated.
