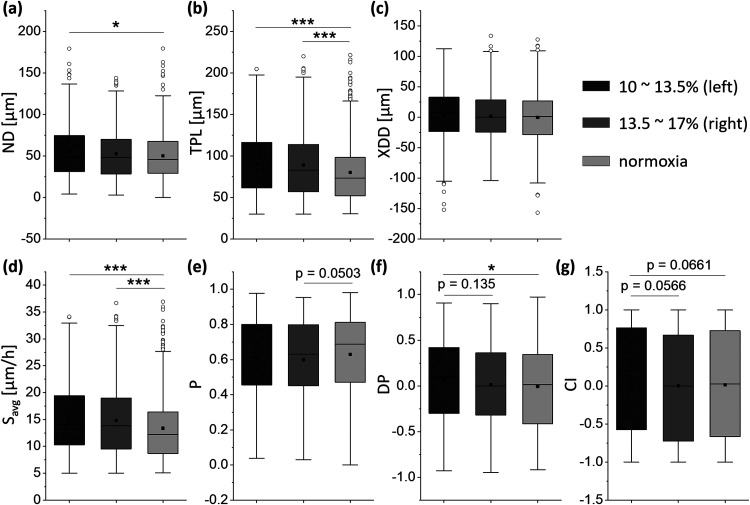
FIG. 4.
Motility and directionality affected by oxygen tension. (a) The net displacement, ND. For 6 h, the cancer cells had greater ND under gradient conditions and the trend increased with lower oxygen levels. (b) The total path length, TPL. Like (a), TPL also had a higher value when the oxygen tension gradient was formed, and the tendency was larger at lower oxygen tension. (c) The x-directional displacement, XDD. Under gradient conditions, cancer cells showed a small tendency to move toward higher oxygen levels. (d) The average speed, Savg. The cancer cells had higher Savg at lower oxygen tensions. (e) The persistence, P. The cancer cells showed similar values of P regardless of differences in oxygen tension. (f) The directional displacement, DP. Under the oxygen tension gradient, the cancer cells tended to migrate in the direction of higher oxygen tension, and this tendency was more enhanced in the low oxygen tension range. (g) Chemotaxis index, CI. Although the cancer cells tended to migrate toward the higher oxygen tension side in the low oxygen tension range, CI did not show any significant difference as in DP. For left gradient, right gradient and normoxia in order from left, 391 cells (7 devices), 334 cells (7 devices), and 590 cells (10 devices) were analyzed. The lower and upper boundaries of each box represent 1st quartile (Q1) and 3rd quartile (Q3), respectively, and the whisker ranges from minimum to maximum, where the minimum and maximum are Q1 minus 1.5 times the box's interquartile range and Q3 plus 1.5 times the interquartile range, respectively. The horizontal line and the rectangular dot in each box are the median and the mean, respectively, and the circular points outside the whisker is the outliers. *p < 0.05, **p < 0.01, and ***p < 0.001.

