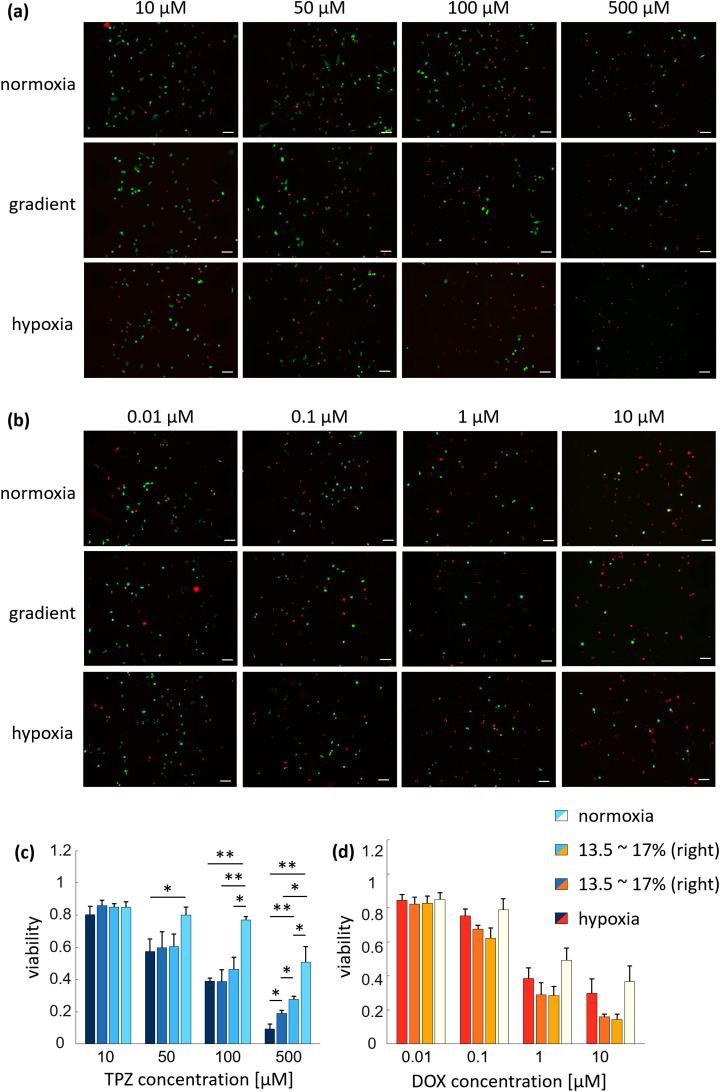
FIG. 5.
Anticancer efficacy under various oxygen levels. (a) Representative live/dead micrographs different oxygen tensions and TPZ concentrations. (b) Representative live/dead micrographs with different oxygen tensions and DOX concentration. (c) Viability of the cancer cells for different TPZ concentration and oxygen tensions. As the concentration of TPZ increased, the viability was greatly affected by oxygen tension. In particular, at 500 μM, the viability of the cancer cells was significantly different due to the difference in oxygen tensions. The lower the oxygen tension, the lower the viability of the cancer cells. (d) Viability of the cancer cells for different DOX concentrations and oxygen tensions. Cancer cells were not significantly affected by oxygen tension at the same DOX concentration. Although not significant, the viabilities were lower in the gradient conditions than in other conditions. For each condition, three devices were used. Scale bars = 100 μm. Error bars represent the standard error of the mean (n = 3). *p < 0.05 and **p < 0.01.

