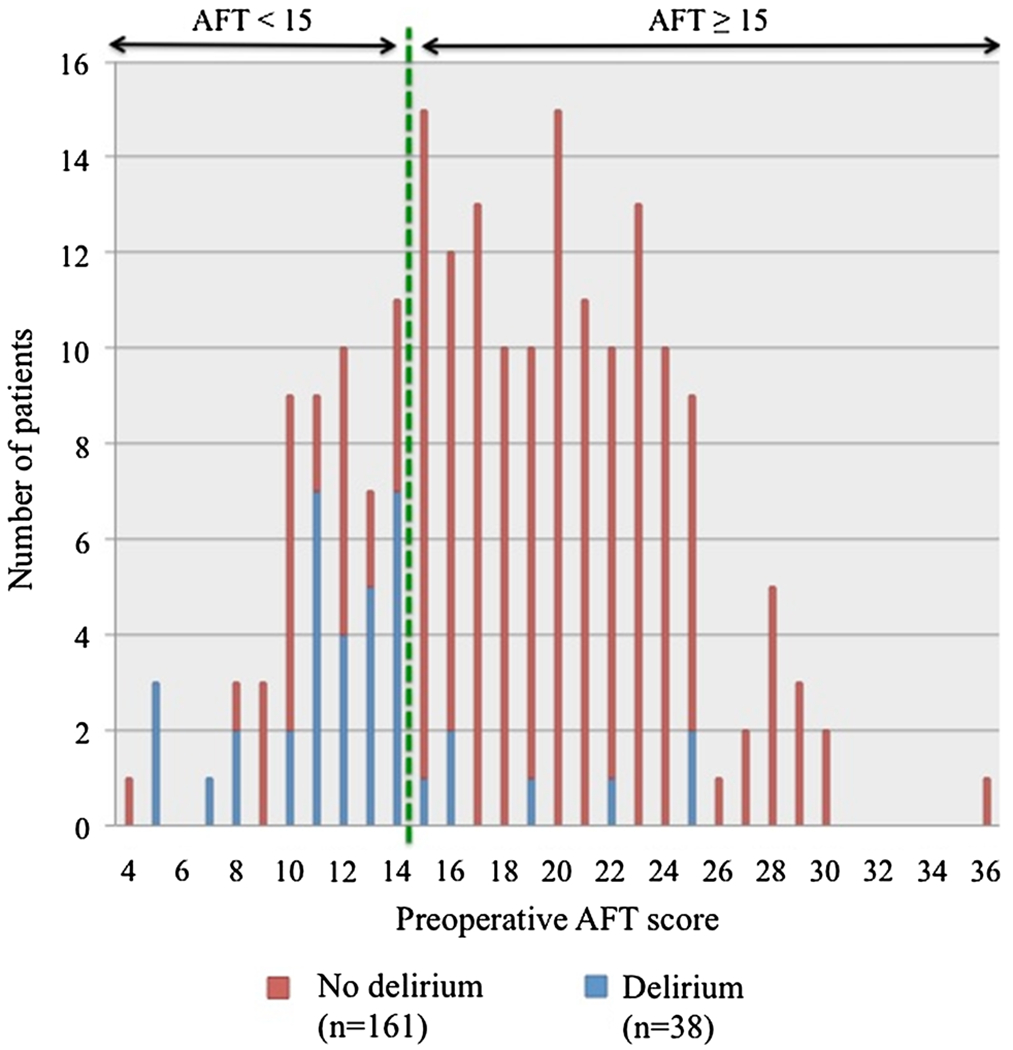
Fig. 2.

Number of patients with and without postoperative delirium at any given animal fluency test (AFT) score. The AFT scores (range 4-36) are shown on the horizontal axis. Numbers of patients with those AFT scores are shown on the vertical axis. Blue bars = patients who developed postoperative delirium; red bars = patients who did not develop delirium; bars to the left of the green dotted line = patients whose AFT scored was<15. It is evident that patients with scores<15 were more likely to develop delirium, as seen by the predminance of blue bars to the left of the green dotted line and red bars to the right of it
