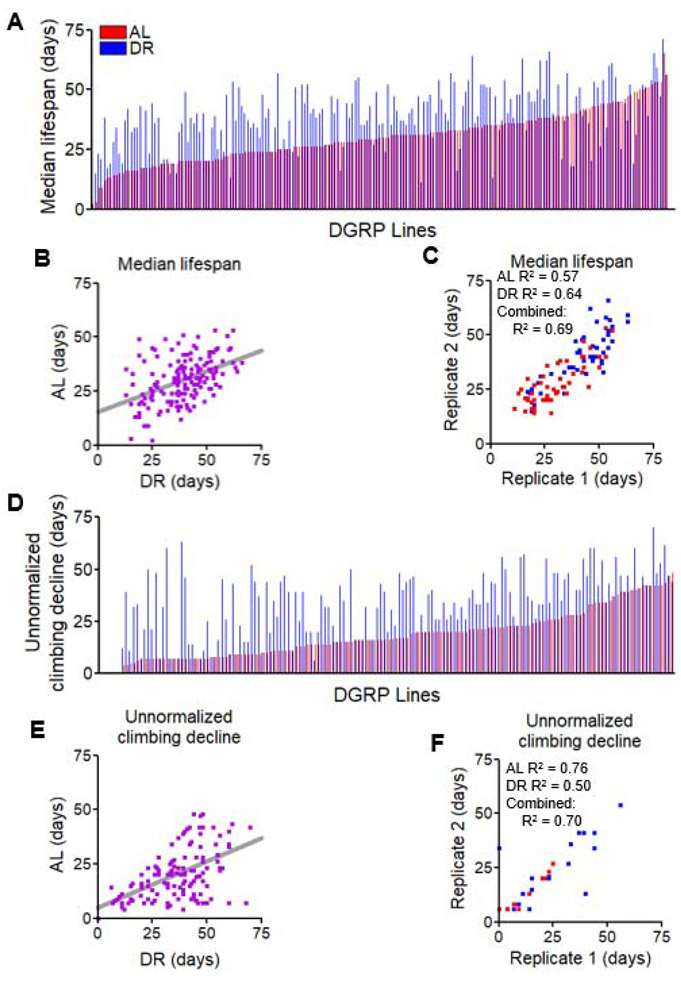
Figure 1. Genotype influences variation in lifespan, climbing ability, and response to DR across the DGRP lines.
(A) Median lifespan of 161 DGRP lines in ascending order under AL diet (red). Adjacent lines in blue represent the same strain raised under DR diet. (B) Comparison of median lifespan under AL of each strain with its DR counterpart. Same data as in A, displayed as a scatterplot. Grey bar represents best-fit trendline. (C) Comparison of median lifespan values across biological replicates of 52 DGRP lines under AL (red) and DR (blue). (D) The age (in days) at which fewer than 20% of the surviving population can climb in the allotted time. Data are arranged in ascending order by the phenotype under AL diet (red) with adjacent lines representing the same strain under DR (blue). (E) Comparison of each strain’s climbing data between AL and DR diets. Grey line represents best-fit trendline. (F) Comparison of biological replicates for 25 tested DGRP lines for the day at which less than 20% of surviving flies are able to climb under AL (red) and DR (blue). N = 50-200 flies per strain per diet. Data used found in Data S1 and Data S2. See also Figure S1.

