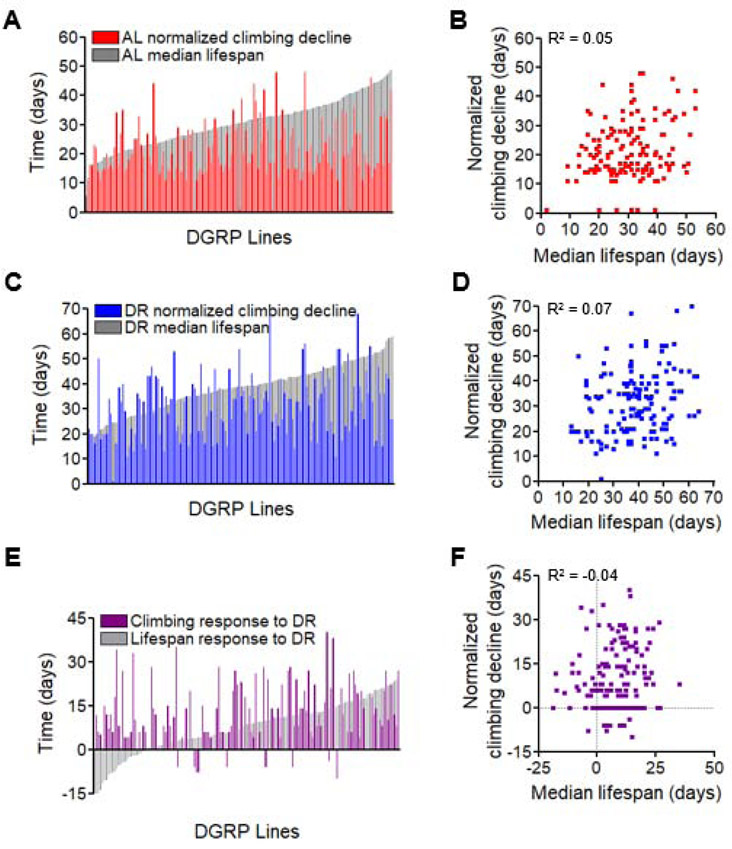
Figure 2. Genotype and diet differentially influence lifespan and climbing decline.
(A-D) Comparison of each tested strain’s day below 50% of maximal climbing proportion with median lifespan, on (A-B) AL or (C-D) DR. Each bar in A and C represents a DGRP strain, ordered by median lifespan on each diet. Colored bars represent climbing half-life and grey bars represent median lifespan. (B and D) Scatter plots depicting climbing ability compared to median lifespan on the (B) AL diet or (D) DR. Each dot represents a single DGRP strain. (E) Comparison of DR responsiveness with regards to median lifespan (grey bars) and time above 50% initial climbing ability (purple bars). (F) Scatter plot depicting response to DR of each tested DGRP line with regards to median lifespan and amount of time above 50% initial climbing ability. Each dot represents a single DGRP strain. N = 50-200 flies per strain per diet. Data used found in Data S1 and Data S2. See also Figure S2.

