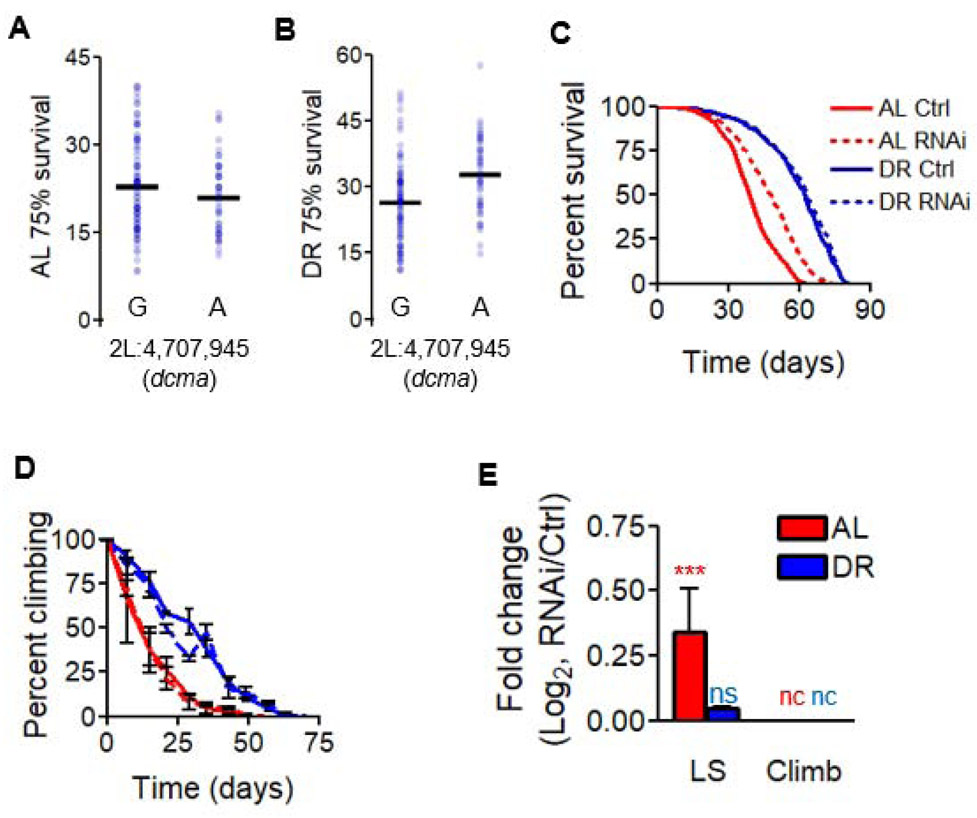
Figure 4. decima modulates longevity in a diet-dependent manner.
(A and B) ALignment of all 161 DGRP lines according to genotype at a particular locus in dcma and according to the day at which ≤ 75% of flies in a strain remain alive on (A) AL or (B) DR. Strains’ median lifespans are represented by blue dots, black bars represent mean values across all tested strains with a given genotype and diet. Significance for diet interaction p < 9E-5, FDR = 8%. (C-E) The effect of neuron-specific RNAi of dcma using the v30160 transgenic line in modulating (C) lifespan and (D) climbing ability over the course of life, with (E) log2 fold-change between RNAi and control for both median lifespan and unnormalized climbing decline values. AL shown in red, DR in blue. Significant differences between RNAi and controls are indicated by *. * = p < 0.05, ** = p < 0.005, *** = p < 0.0005, determined by unpaired t test. p values shown in Data S3. nc = no change, ns = not significant. N = 200 flies per condition for each RNAi experiment. Data in (C-E) show collective results from three biological replicates. Error bars represent SD between replicates. See also Figure S3H-K, Figure S4C-D. RU486 controls shown in Figure S5.

