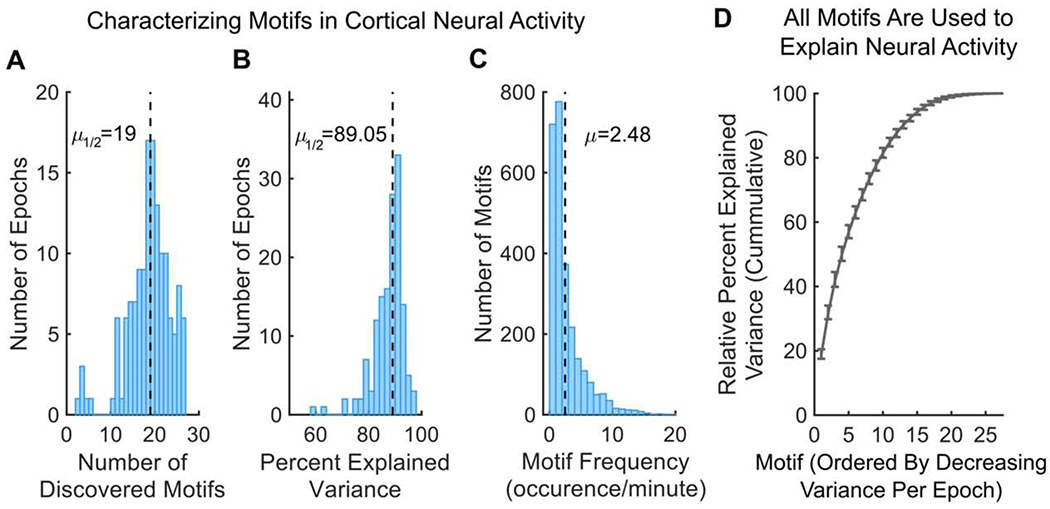
Figure 2. Motifs capture majority of variance in neural activity.

(A) Distribution of number of discovered motifs per discovery epoch (N=144). Dotted line indicates median. 2622 motifs were discovered in total.
(B) Distribution of the total percent of variance in neural activity explained by motifs per discovery epoch. Dotted line indicates median.
(C) Distribution of how often motifs occurred during discovery epochs. A motif was considered active when its temporal weighting was 1 standard deviation above its mean (e.g. transients in Figure 1C in occurrences per minute; see STAR Methods). Dotted line indicates mean.
(D) Cumulative sum of relative percent explained variance (PEV) of each motif in withheld epochs. Relative PEV was calculated as the PEV of each motif divided by the sum of all motif PEVs in an epoch. For each epoch, motifs are ordered by their relative PEV (i.e. the first motif is the most common motif, which is not necessarily the same motif for all epochs). Line and error bars indicate mean and 95% CI, respectively.
All p-values estimated with Wilcoxon Signed-Rank tests. See also Figures S1, S2, and Tables S1, S3.
