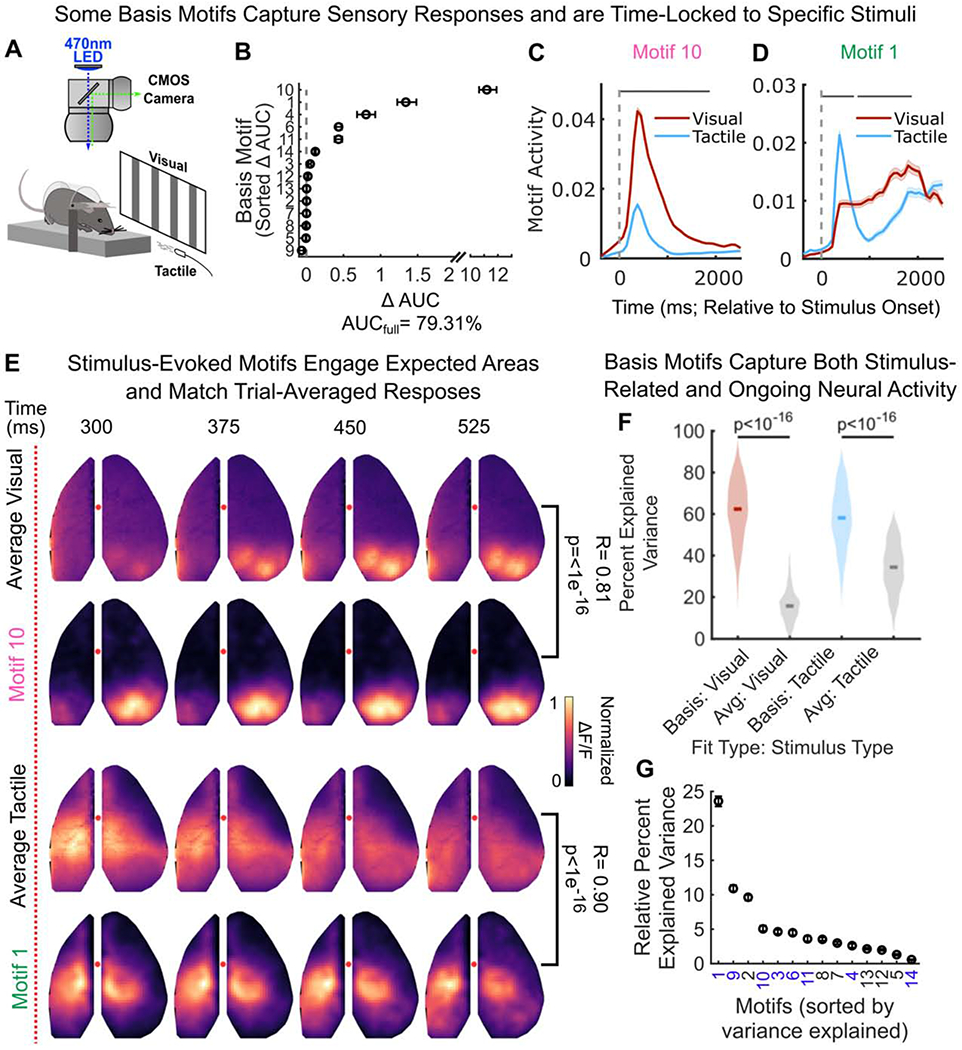
Figure 5. Specific basis motifs reflect processing of specific stimulus modalities.

(A) Schematic of sensory stimulation paradigm. All stimuli were delivered on animals’ left side.
(B) Contribution of each motif to decoding whether a visual or tactile stimulus was delivered, assessed as the decrease in decoding accuracy when a motif is left out (see STAR Methods). Motifs ordered by decreasing contribution. Marker and error bars show median and 95% CI of 50 cross-validations. AUCfull reflects decoding accuracy when using all motifs.
(C-D) Timecourse of (C) motif 10 and (D) motif 1 activity relative to stimulus onset (vertical dotted line). Lines and shaded regions indicate mean +/− SEM motif activity in response to visual (red; N=1109) and tactile (blue; N=1110) stimulation. Motif activity calculated as the mean pixel value of a motif reconstruction over time (see STAR Methods). Horizontal grey bar indicates significant difference in motif activity between visual and tactile stimuli (pBonferroni < 0.05, two-sample t-test; see STAR Methods).
(E) Comparison of the trial-averaged stimulus-evoked response and the stimulus-evoked response of the selective basis motifs in C-D. First two rows show responses for visual stimuli; third and fourth rows for tactile stimuli. Correlation between average response and basis motif is indicated along right side (pixelwise correlation, Pearson’s ρ). As amplitude of response is arbitrary, pixel intensities were normalized from 0-to-1 before correlation.
(F) Basis motifs explain more of the variance in neural activity than the average stimulus response. Distributions show the percent of variance in neural activity during the 5s after stimulus onset explained by basis motifs (colors) or average responses (gray). Full distribution shown; dark lines indicate median. Significance computed with Wilcoxon Signed-Rank test.
(G) Relative percent of the variance captured by each motif across all sensory trials, during the 5s after stimulus onset. Marker and error bars show median and 95% CI. Purple labels denote motifs that contributed to stimulus decoding (panel B) and/or were stimulus-evoked (Figure S6). Black labels denote motifs that were not related to visual or tactile stimuli.
