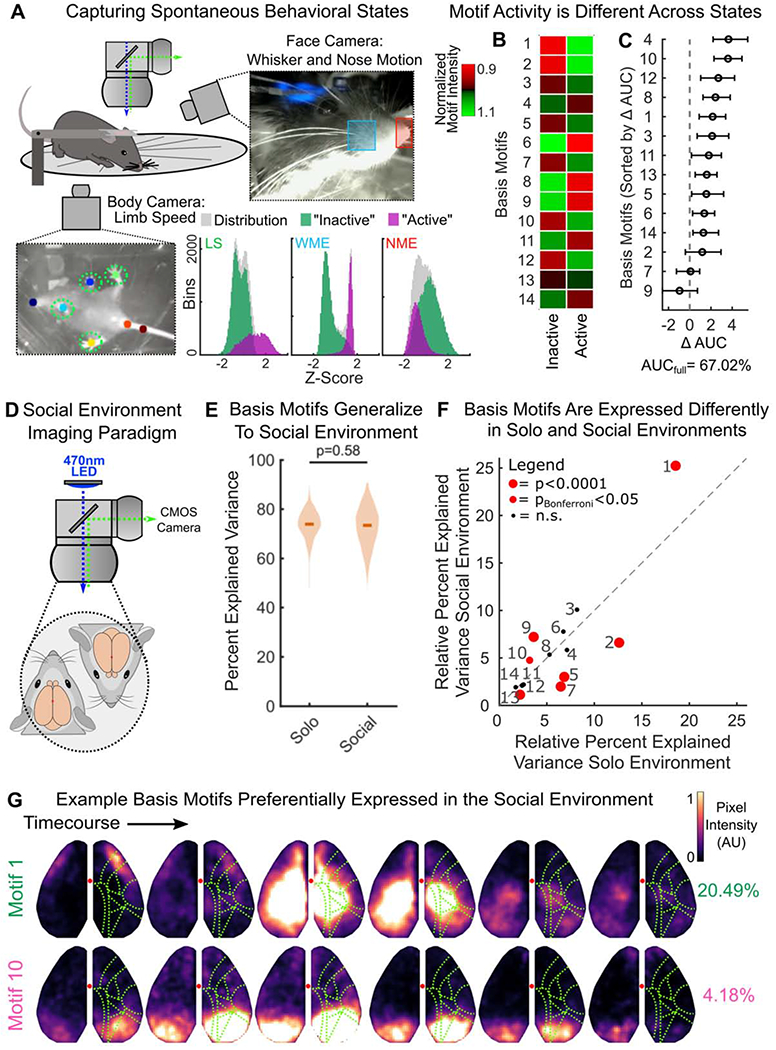
Figure 7. Basis motifs generalize to new animals, across behavioral states, and to social environments.

(A) Schematic of simultaneous mesoscale imaging and video capture of spontaneous behavior of head-fixed mice on a transparent treadmill. Two new mice, not from the original cohort, were used. Blue and red squares indicate area used to measure whisker pad motion energy (WME) and nose motion energy (NME), respectively. Colored dots indicate tracked position of the forelimbs, nose, and tail. These were used to estimate limb speed (LS). Distribution of behavioral variables are shown in three histograms along bottom. Gaussian mixture models fit to the distributions of LS, WME, and NME simultaneously. Two states were discovered: an “active” and “inactive” state (inset; purple and green respectively, see STAR Methods).
(B) Motif activity in active and inactive behavioral states. Heatmap shows the relative mean activity of each motif (y-axis) during each state (x-axis). Motif activity was estimated as the mean pixel value of a motif reconstruction over time during N=498 periods of activity/inactivity during 2 hours of recording (see STAR Methods). To assess relative activity in each behavioral state, motif activity was normalized by the mean activity in each state (e.g. divided by column mean), and then normalized to the mean activity in across states (e.g. divided by row mean). Data is combined across animals, who both were in the active state the majority of the time (active: 87% and 72%; inactive: 13% and 28% of time for each animal, respectively).
(C) Motif contributions to decoding active vs inactive behavioral states. Motifs ordered by decreasing contribution. Marker and error bars show mean and 95% CI of 50 cross-validations. AUCfull reflects decoding accuracy when using all motifs.
(D) Schematic of social environment imaging paradigm.
(E) Comparison of the percent of variance in neural activity that could be explained when animal was alone (at rest, ‘solo’) or when paired with another animal (‘social’). Basis motifs were estimated in the solo setting and then fit to withheld data in both settings (as in Figure 4C; N=144 and N=123 withheld epochs for solo and social settings, respectively). Full distribution shown; dark lines indicate median.
(F) Scatter plot of the relative variance captured by each basis motif in the solo environment (x-axis; N=144 epochs) versus the social environment (y-axis; N=123 epochs). Motif labels are indicated with numbers, red markers indicate significant differences in expression rate between environments. Identity line shown along diagonal.
(G) Example basis motifs preferentially expressed in the social environment. Display and motif labels follow Figure 4.
All p-values estimated with Mann-Whitney U-test. See also Figures S3, S7, and Tables S1, S3.
