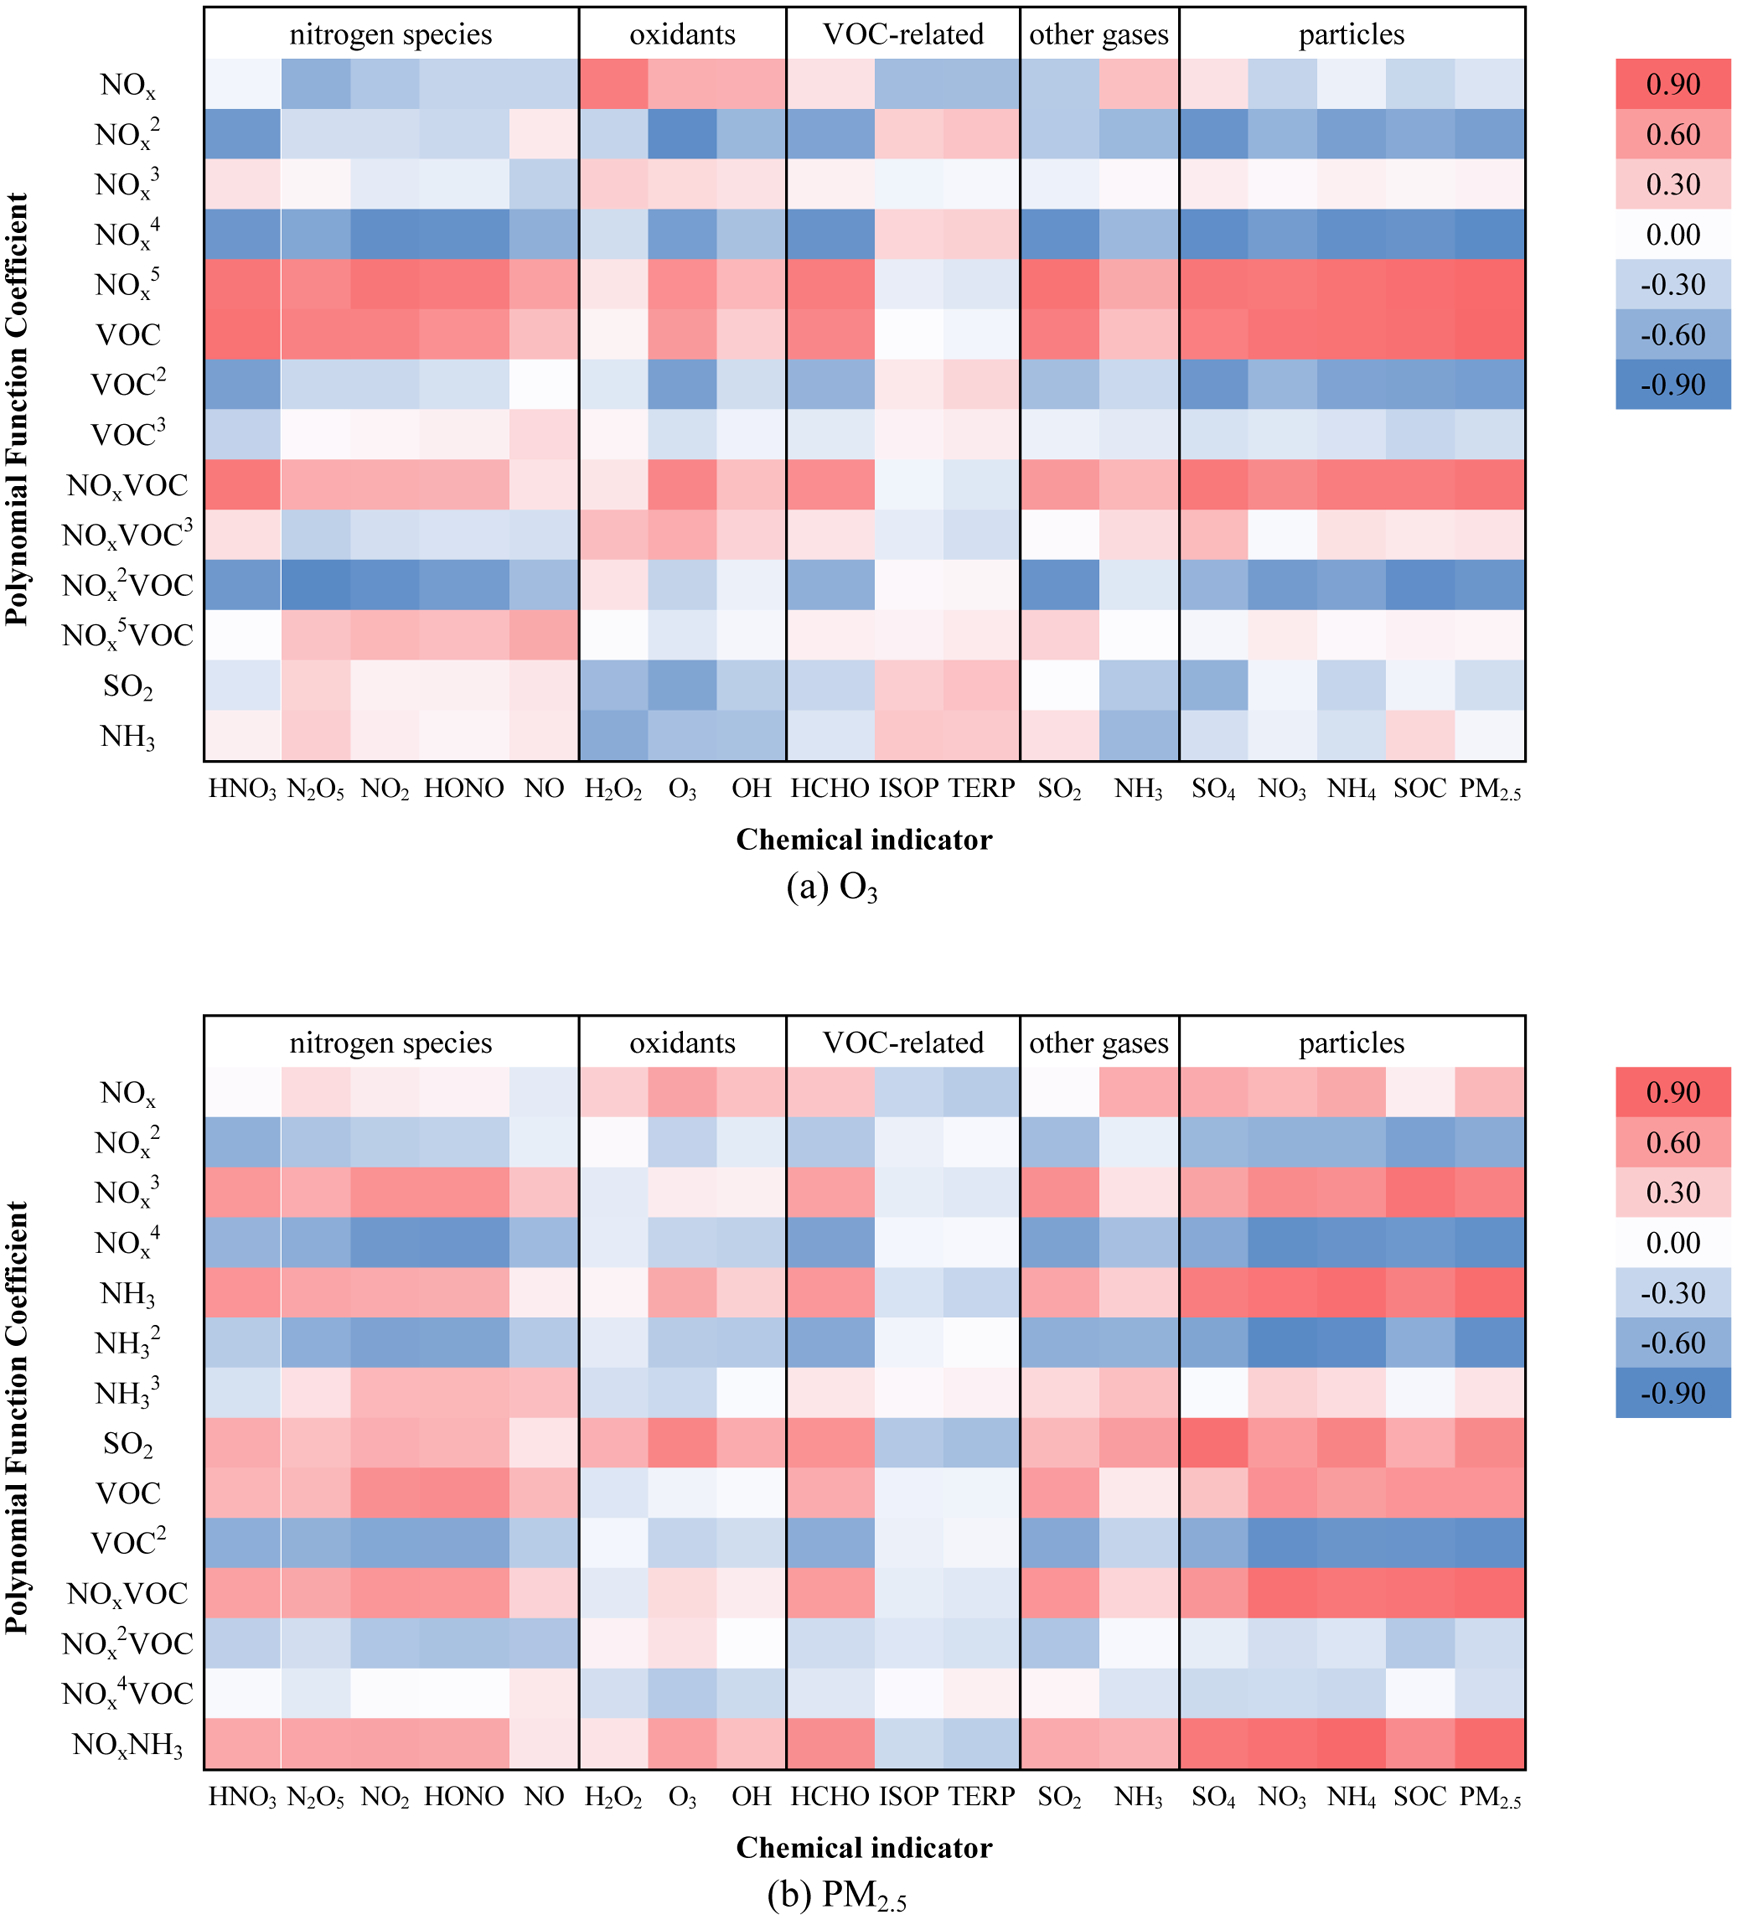
Figure 1.

Correlation among the 14 coefficients (row) of terms in the response functions for O3 (a) and PM2.5 (b) and the incremental change in concentrations of the indicators (column) between the baseline and clean-condition simulations for the CN27 domain.
