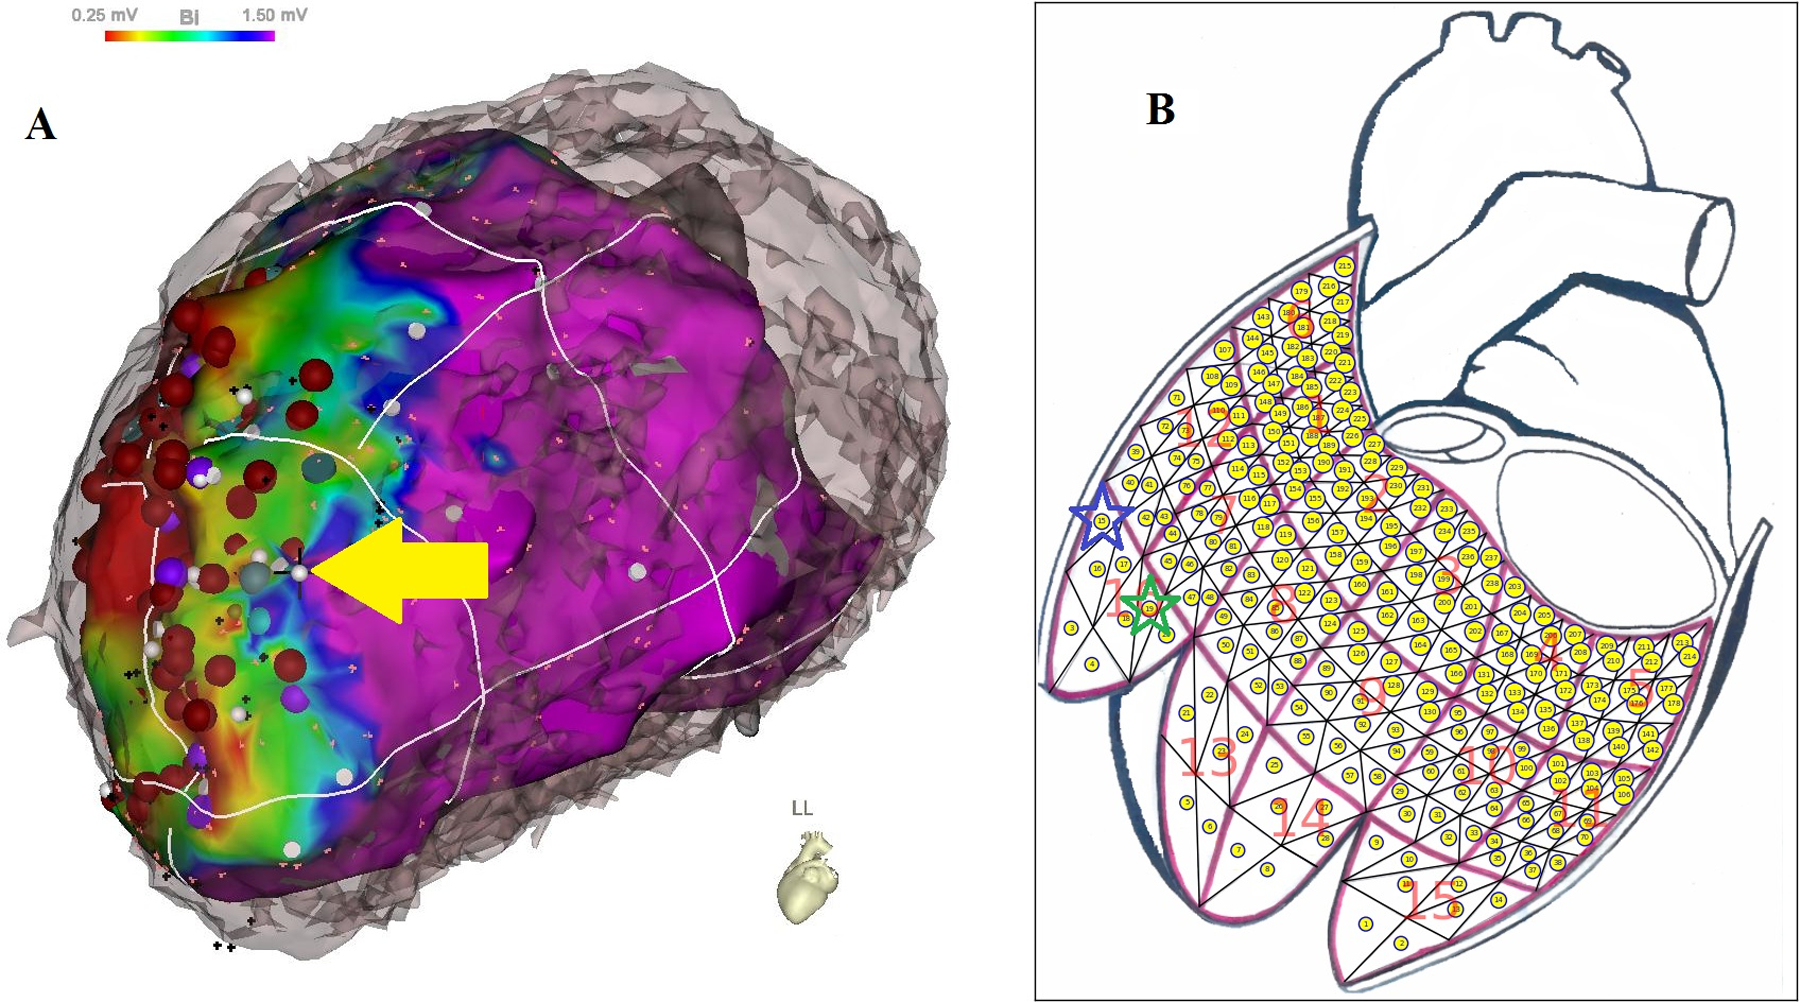
Figure 1.

Registration of an identified VT-exit site. (A) A VT-exit site was identified by a combination of activation mapping (27) and entrainment mapping during VT (28), supplemented by pace-mapping at the scar margin (29–30); the identified VT-exit site marked by a white dot and yellow arrow) was located on the bipolar potential map aligned with patient’s own CT geometry. (B) The identified VT-exit site was registered from the bipolar potential map to one of 238 triangular area elements within a 16-segment generic LV endocardial surface by observer #1 with green star and observer #2 with blue star, respectively.
