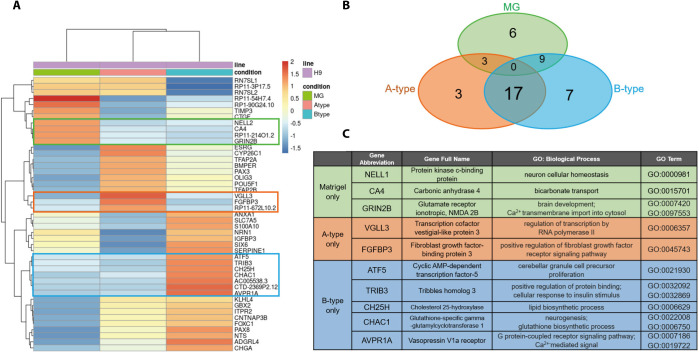
Fig. 4. Comparative transcriptome analysis by RNAseq.
(A) A heatmap showing genes upregulated in cells grown on various substrates. Green, orange, and blue boxes indicate genes exclusively upregulated in the cells differentiated on MG, A- and B-type scaffold, respectively. (B) Venn-diagram showing the number of genes that are differentially expressed among groups, (C) A list of genes that were exclusively upregulated in each substrate and GO term analysis.

