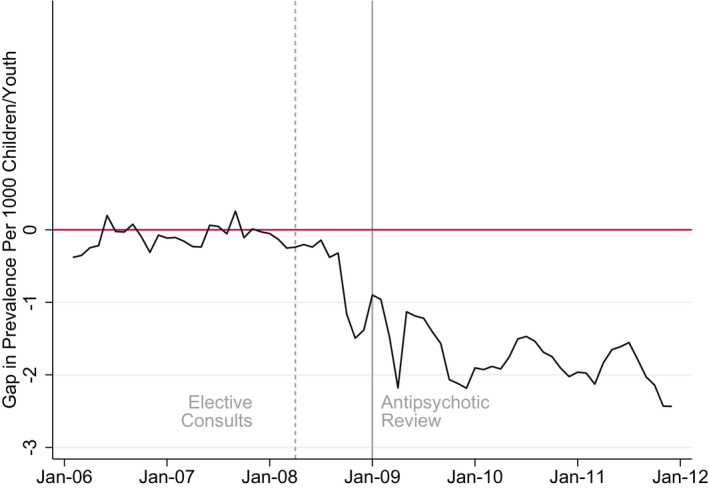
FIGURE 2.

Difference between WA and Synthetic WA in Monthly Rates of Antipsychotic Prescription Fills [Color figure can be viewed at wileyonlinelibrary.com]
Notes: The plot represent the monthly gap between prevalence rates for Washington State and its synthetic control.
