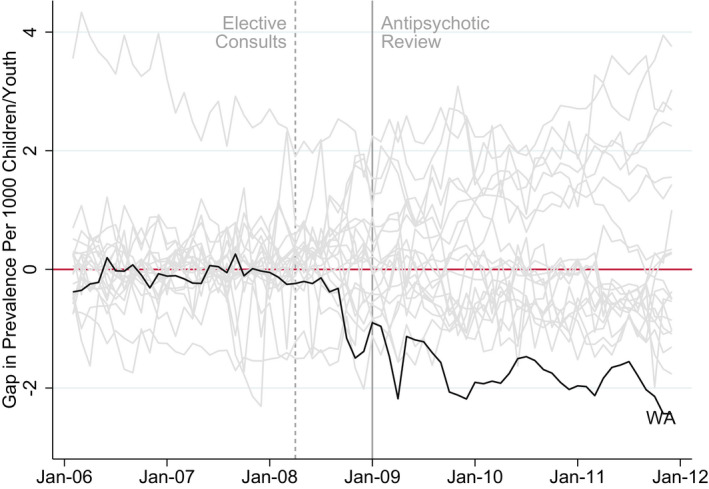
FIGURE 3.

Falsification Tests [Color figure can be viewed at wileyonlinelibrary.com]
Notes: Falsification test procedure applies synthetic control method to each of the 20 states, shifting Washington to the donor pool. Each gray plot represents the gap between prevalence rates for a state and its synthetic control. The combination of these gray plots provides us a distribution of estimated gaps for the states where no intervention took place. The black plot represents the gap between prevalence rates for Washington State and WA’s synthetic control
