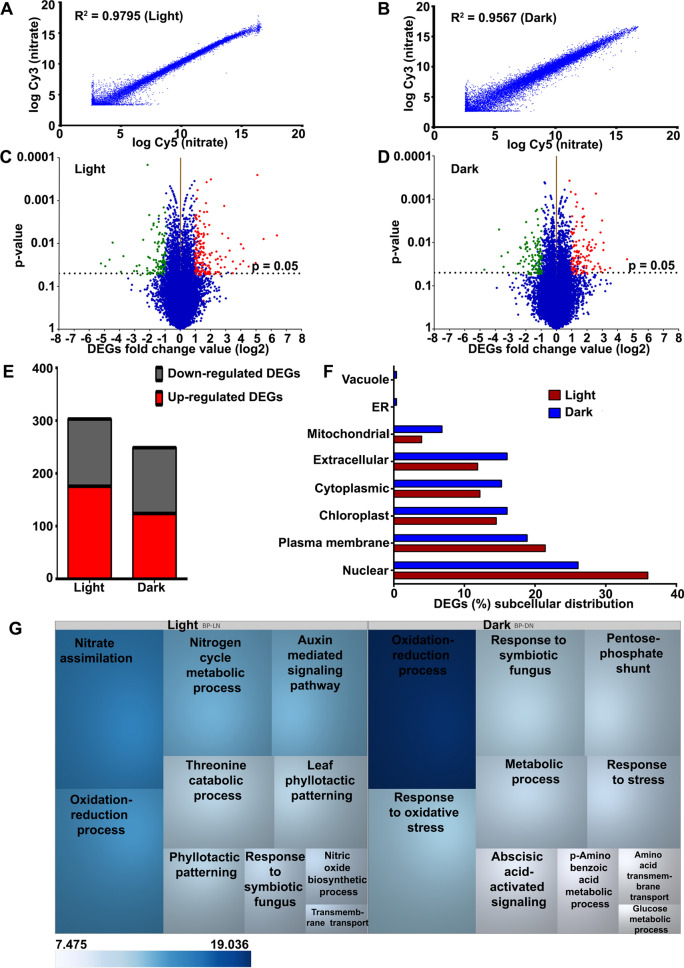
Figure 2.
Analysis of nitrate-responsive leaf transcriptomes of light-grown and etiolated rice seedlings. Scatter plots show the correlation between the biological replicates of transcriptomes in light (A) and dark (B) conditions. The correlation coefficients of normalized ratios were calculated between the dye swapped nitrated treated samples in light (R2 = 0.9795) and dark (R2 = 0.9567). The volcano plots of microarray data are shown for light (C) and dark (D). The X-axis represents the fold change (log2) and p-value on Y-axis. The dashed horizontal line shown on the plots represents the p value cut-off (p = 0.05) and the genes above this line are statistically significant. Each transcript is represented by scattered dots. The red and green coloured scattered dots represent the up- and down-regulated DEGs, respectively. (E) Column graph shows the numbers of up-regulated or down-regulated nitrate-responsive genes in light and dark conditions. (F) Bar graph depicting the subcellular localization of DEGs-encoded proteins identified in light and dark. (G) The DEGs were functionally annotated into different biological processes using Expath tool. Top 10 statistically significant biological processes (P < 0.05) were visualized using TreeMap software (https://www.treemap.com/). The size of the box is inversely proportional to the ranking of the biological processes by p value and coloured according to their statistically significant p value (−log2). In other words, a biological process with the lowest p value has the biggest box size and its colour intensity shows its statistical significance. BP-LN biological process-light nitrate, BP-DN biological process-dark nitrate.

