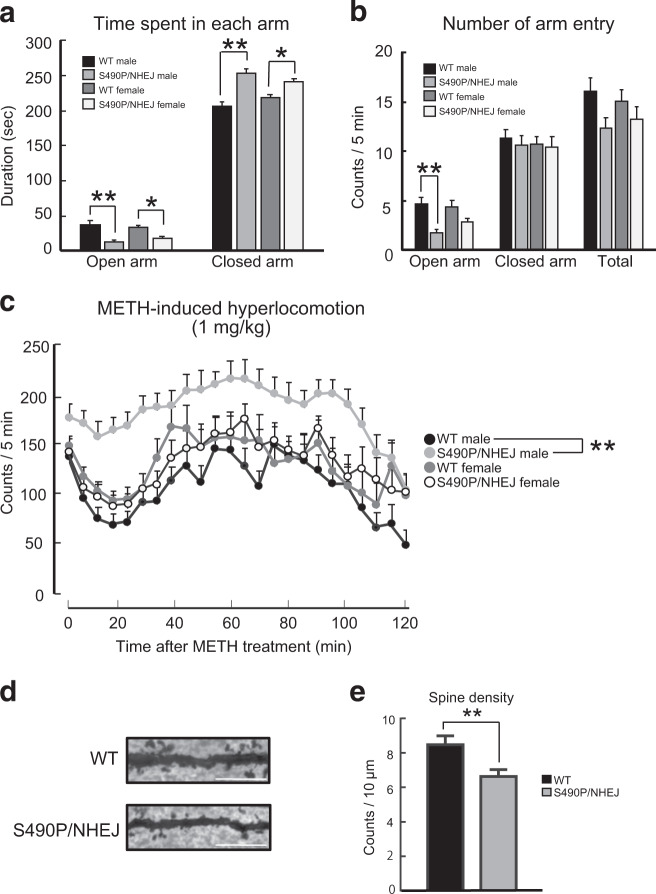
Fig. 3. Behavioral abnormalities and changes in dendritic spine density of Case#5 model mice.
a, b Performance in the elevated plus maze test. The time spent in each arm was determined according to genotype and sex. Values indicate the mean ± S.E.M [WT male (n = 18), WT female (n = 20), Arhgap10 S490P/NHEJ male (n = 21), and Arhgap10 S490P/NHEJ female (n = 21)] (a). The number of arm entries was characterized according to genotype and sex. Values indicate the mean ± S.E.M [WT male (n = 18), WT female (n = 20), Arhgap10 S490P/NHEJ male (n = 21), and Arhgap10 S490P/NHEJ female (n = 21)] (b, c). Performance of Arhgap10 S490P/NHEJ mice in the METH (1 mg/kg, i.p.)-induced hyperlocomotion test. Counts/5 min were determined according to genotype and sex. Values indicate the mean ± S.E.M [WT male (n = 17), WT female (n = 15), Arhgap10 S490P/NHEJ male (n = 19), and Arhgap10 S490P/NHEJ female (n = 15)]. d Representative images of the spines of pyramidal neurons in the mPFC (Golgi staining). Scale bar: 10 μm. e Quantitative analysis of the dendritic spine density of the cortical pyramidal neurons [n = 16 neurons from four mice in each group].

