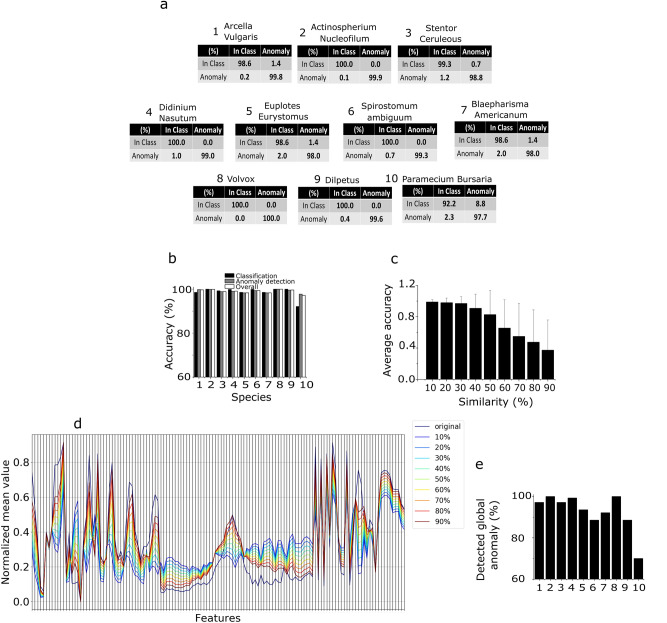
Figure 4.
Delta-enhanced class detector performances and results. a Confusion matrix corresponding to each of the ten neural networks trained on the lensless microscope dataset. b Overall testing accuracy performances for each of the ten testing classes. The number used on x axis to label each species correspond to the species number in panel a. c,d DEC detector anomaly detection performances tested on in silico generated data. c Testing accuracy performances for varying percentage values of in silico species similarity with the trained species. d Example of average features space parallel coordinates plot for the in-silico species obtained using the species Spirostomum Ambiguum. By increasing the similarity, the features of the surrogate species approach the features of the real species, resulting in an increased average anomaly misclassification rate, decreasing the overall accuracy levels. e Detection of unknown species. The panel shows the percentage of samples detected by all the DEC detectors as anomaly, when removing one training species from the set, for each of the ten training species. These numbers reflect the level of accuracy of the proposed algorithm in detecting unseen species. The number used on x axis to label each species correspond to the species number in panel a.

