
Fig. 5. A ‘scaffold’ causal diagram summarising typical medical imaging workflows.
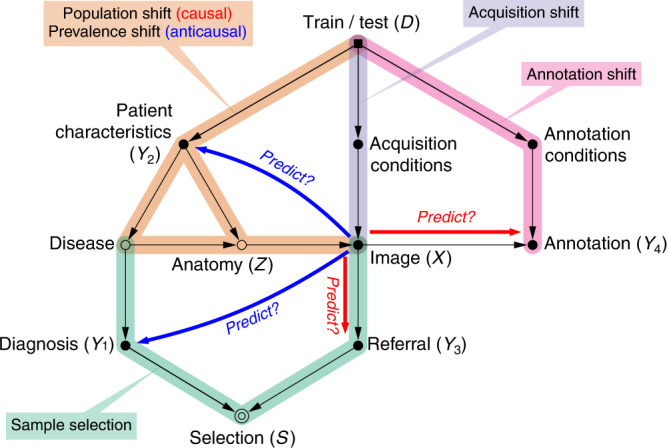
We believe most practical cases can be adapted from this generic structure by removing or adding elements. Here are represented a variety of possible prediction targets (marked Y1–Y4): some anticausal (Y1, Y2) and others, causal (Y3, Y4). ‘Annotation’ here refers to any image-derived data, such as lesion descriptions, regions of interest, spatial landmark coordinates, or segmentation maps. Note that annotators will often be aware of the patients' records and diagnoses, in which cases there could be additional arrows from Y1 or Y2 towards Y4.