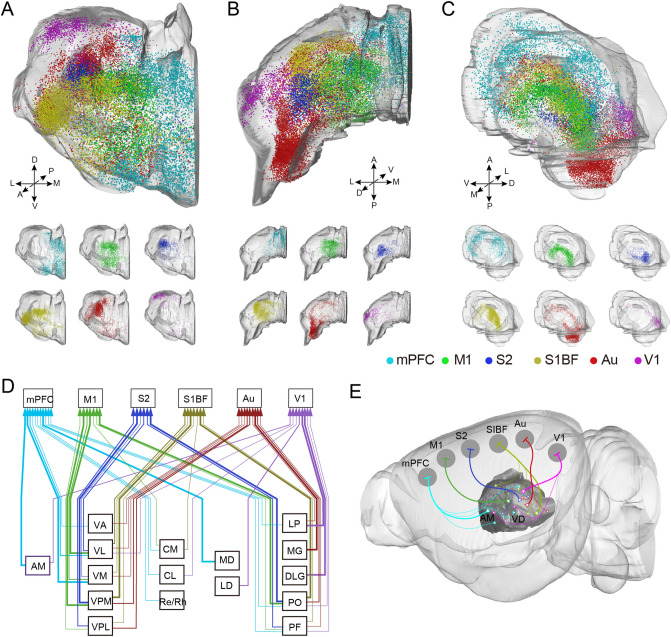
Figure 4.
Region-specific distribution of thalamic inputs to cortical CRH neurons. (A) The front 3D view of input neurons in thalamus. (B) The planform 3D view of input neurons in thalamus. (C) The lateral 3D view of input neurons in thalamus. The top one is the over view of afferent neurons input to CRH neurons in different cortical areas. The six below are input neurons to mPFC, M1, S2, S1BF, Au and V1, respectively. (D) The monosynaptic relationship and intensity between the thalamic nuclei and cortical CRH neurons. Polylines in different color represent the input to different cortical CRH cortex, and the thick arrows indicate dense distribution of input neurons. (E) The diagram of connection between cortical CRH neurons and thalamus. (A,B,C,E) 3D vision displayed via Amira software (v5.2.2, Mercury Computer Systems, San Diego, CA, United States).The abbreviations of brain regions are provided in Supplementary Table S2.

