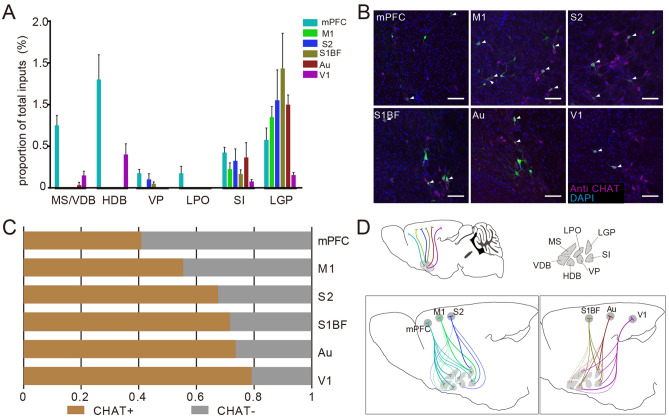
Figure 5.
Inputs in the basal forebrain to cortical CRH neurons. (A) The proportion of input neurons in different subregions of the BF. Different color represent input to CRH neurons in different cortical areas; Data shown as mean ± SEM; mPFC n = 4 mice; M1 n = 4 mice; S2 n = 4 mice; S1BF n = 6 mice; Au n = 4 mice; V1 n = 4 mice. (B) The immunofluorescent staining of cholinergic neurons in LGP. The arrows point to input neurons merged with cholinergic neurons, scale bar = 100 μm. (C) Proportion of cholinergic neurons input to cortical CRH neurons in BF. (D) A diagrammatic drawing of BF cholinergic neurons projected to cortical CRH neurons. The abbreviations of brain regions are provided in Supplementary Table S2.

