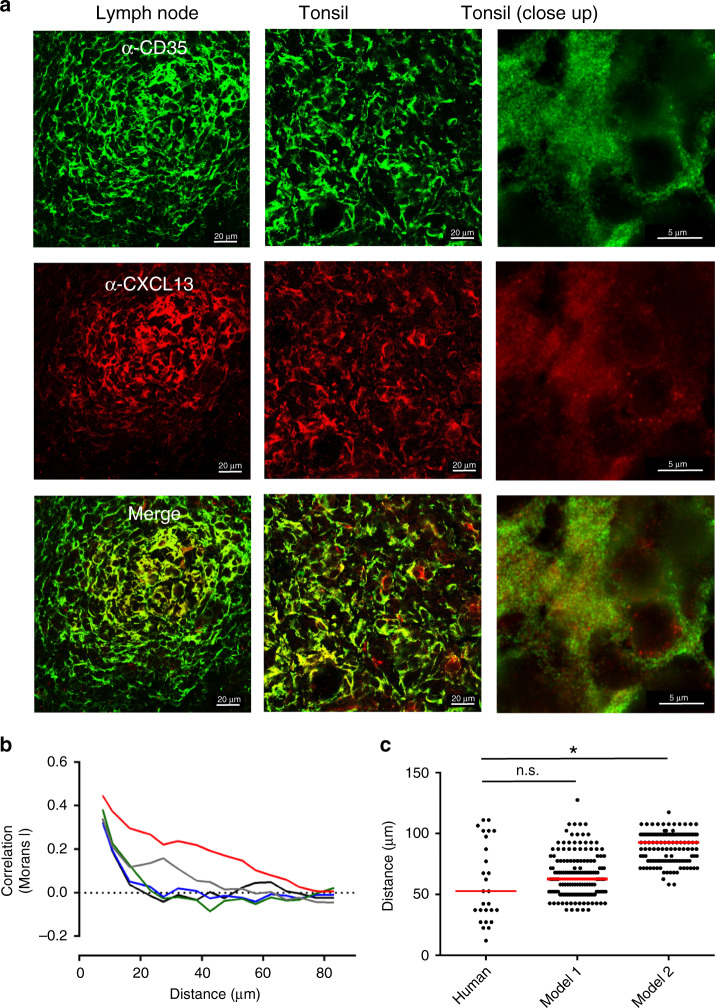
Fig. 4. Analyzing the spatial distribution of the immobile CXCL13 fraction.
a IHC staining of the FDC marker CD35 (green) and CXCL13 (red) in human lymph nodes and tonsils. b The spatial autocorrelation of CXCL13 expression in samples from one patient, each line represents the spatial autocorrelation for a distinct follicle. c Comparison of the distances at which no statistically significant spatial autocorrelation (determined using permutation testing as described in “Methods”) was detected in human tonsils, and for models 1 and 2. Each data point represents the distance at which no statistically significant spatial autocorrelation was observed for the intensity of anti-CXCL13 staining in a distinct tonsil follicle, with data pooled from five different patients. The red line represents the median distance for each group with significance, the human dataset and each simulation model (run with 200 repeat executions) assessed using the Mann−Whitney U test (p value = 0.06 for model 1 and p < 0.001 (denoted as *) for model 2). Source data are provided as a Source Data file.

