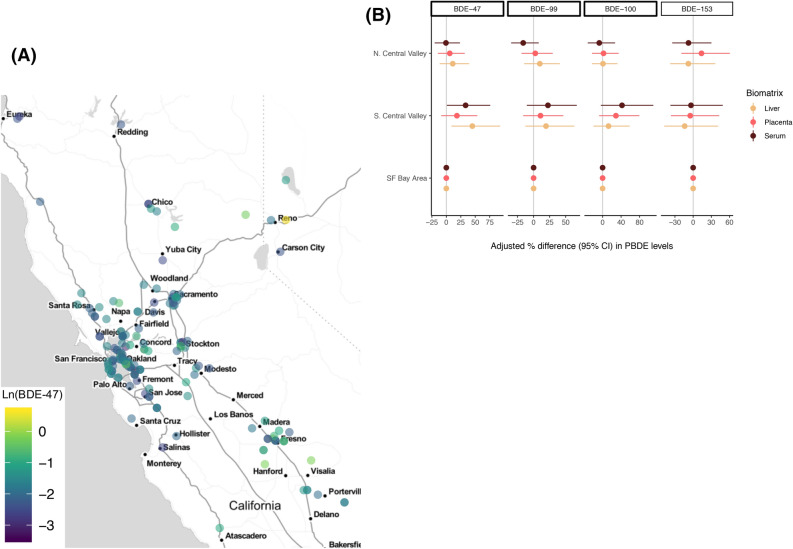
Figure 5.
Unadjusted wet-weight BDE-47 levels in maternal serum (ng/ml) by zip code (A) and adjusted percent (%) difference in serum PBDE levels between geographical regions of residence by congener and biomatrix (B) during mid-gestation (study waves 3–4; 2014–16; n = 180). Modeled differences were adjusted for educational attainment, gestational age (continuous), year of sample collection, and tissue-specific total lipid levels as independent covariates. Number (%) evaluated in each region of residence = 99 (61%), 24 (15%), 39 (24%), for SF Bay Area, South Central Valley/Fresno, and North Central Valley (including the North Coast and Sierras), respectively. Map generated in R (Version 3.5.1) using the qmplot function (https://journal.r-project.org/archive/2013-1/kahle-wickham.pdf).

