
Figure 2.
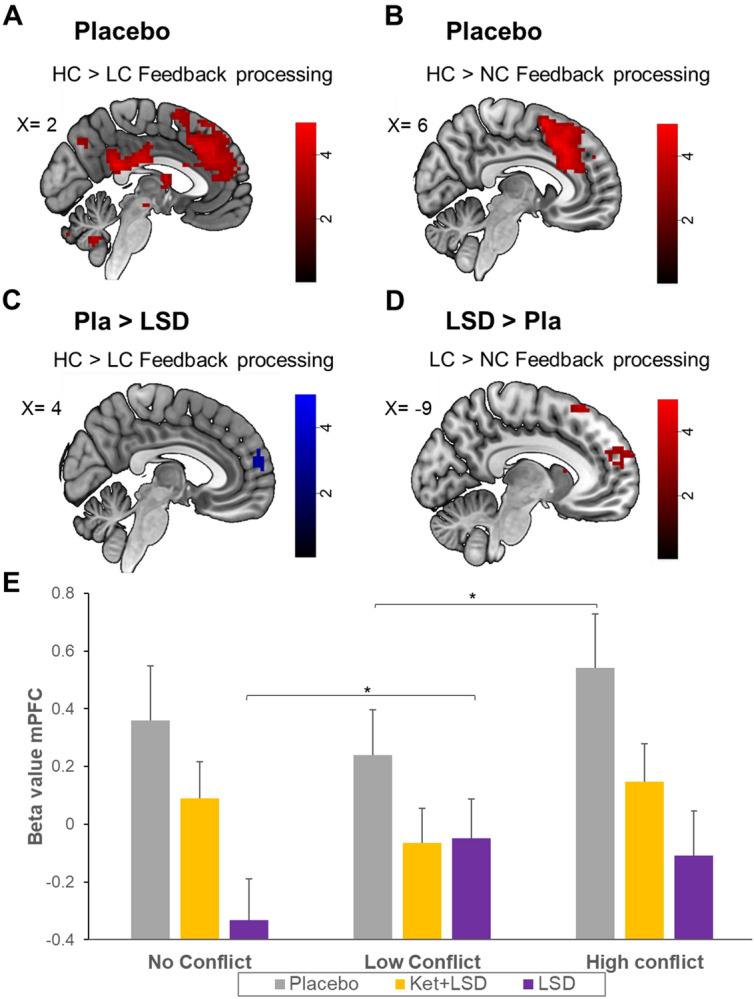
Feedback processing in the Placebo and in the LSD compared to the Placebo condition. Differences in BOLD signals for (A) HC > LC contrast for the feedback processing (FB) for Pla at peak in the mPFC voxel (x = − 3, y = 47, z = 25); (B) HC > NC FB contrast for Pla at peak SMA voxel (x = 6, y = 29, z = 52); (C) HC > LC FB contrast for Pla > LSD at peak mPFC voxel (peak: x = 0, y = 59, z = 19); (D) LC > NC FB contrast for LSD > Pla at peak mPFC voxel (peak: x = − 9, y = 62, z = 25); p < 0.05 FWE corrected (peak level after SVC). Red Shades represent an increase in BOLD signal. Blue shades represent an LSD-induced decrease in BOLD signal. Colorbars indicate t-values. Data displayed at p < 0.005, k > 10 (uncorrected). n = 24. (E) Comparison of Beta values in the mPFC for all conditions and treatments. Data are displayed as mean and standard error of the mean. *p < 0.05, Bonferroni corrected.