
Figure 3.
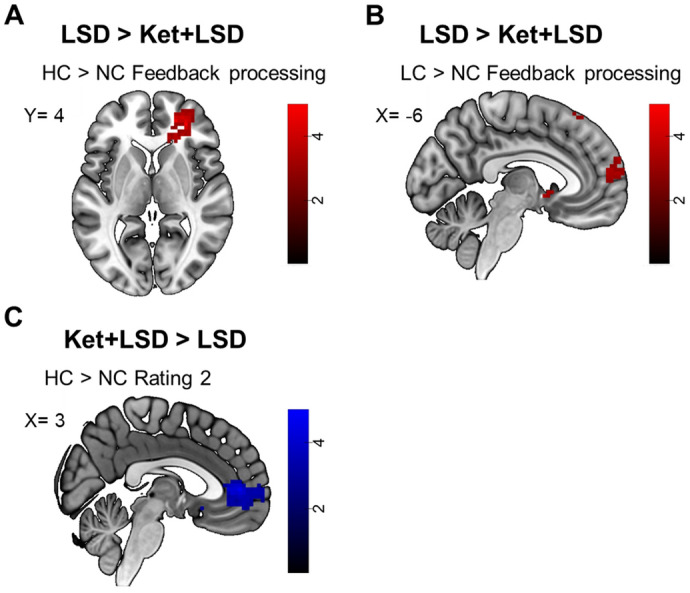
fMRI data. Differences in BOLD signal for (A) HC > NC FB contrast for LSD > Ket + LSD at peak inferior frontal gyrus voxel (peak: x = 30, y = 44, z = 4); (B) LC > NC FB for LSD > Ket + LSD at inferior frontal gyrus voxel (peak: x = 30, y = 41, z = 4); (C) HC > NC Rating 2 contrast for Ket + LSD > LSD at peak medial OFC voxel (peak: x = 3, y = 47, z = 4); p < 0.05 FWE corrected (peak level after SVC); Blue shades represent an LSD-induced decrease in BOLD signal. Red Shades represent an LSD-induced increase in BOLD signal. Colorbars indicate t-values. Data displayed at p < 0.005, k > 10 (uncorrected). n = 24.