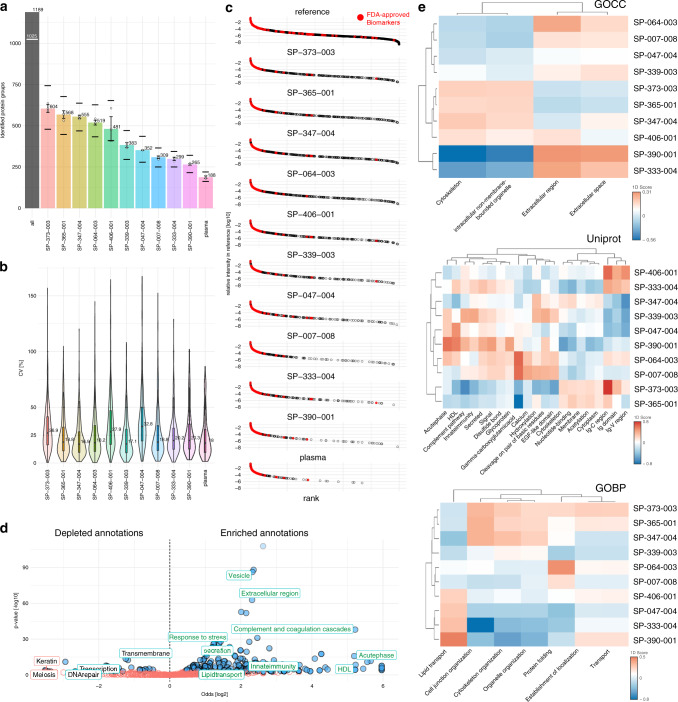
Fig. 4. Optimized panel of 10 SPIONs in comparison to neat plasma.
a Protein groups from the NP corona of 10 SPIONs, quantified by DDA LC-MS/MS (1% protein and peptide FDR). All: number of quantified protein groups across all NPs (excluding neat plasma). White line indicates the number of proteins detected with two or more peptides with at least one NP. For respective NPs median count and standard deviation across three assay replicates are shown as bar plots. Upper dashes depict number of proteins detected in any sample; lower dashes depict number of proteins detected in all three replicates. White circles show number of protein IDs for each assay replicate. b CV% distribution (precision) of the NP protein corona-based workflow for neat plasma and 10 SPIONs (filtering for three out of three valid values across assay replicates). Inner boxplots report the 25% (lower hinge), 50%, and 75% quantiles (upper hinge). Whiskers indicate observations equal to or outside hinge ± 1.5 * interquartile range (IQR). Outliers (beyond 1.5 * IQR) are not plotted. violin plots capture all data points. c Matching 10 SPIONs to a plasma protein database of MS intensities. Ranked intensities for the database proteins5 are shown in the top panel. Most intense protein is in the upper left corner of the panel; least intense is in the lower right corner. Intensities for proteins from neat plasma are shown in the bottom panel (plasma). Intensities for 10 SPIONs are shown in the remaining panels. Red dots indicated FDA-approved protein biomarkers1. d Volcano plot depicting annotation enrichment analysis (Fisher’s exact test) for functional pathways (GOCC,GOBP, KEGG, Uniprot Keywords, Pfam) of proteins detected in the optimized panel of 10 NPs in comparison to the database. Enriched = Log2 Odds > 0; depleted = Log2 Odds < 0. Blue circles indicated pathways with a Benjamini–Hochberg (B.H.) false discovery rate (FDR) < 1%. Green annotations indicate some enriched annotations enriched for NPs. Selected depleted annotatons are depicted in black. Keratin and Meiosis are depleted annotations with a B.H. FDR > 5%. e 1D annotation enrichment analysis comparing the protein intensity distribution (median intensity across assay triplicates, requiring three out of three quantifications) of each NP against the average of all. 1D scores are plotted as heat maps for annotations (minimal size 11) that are significantly enriched or depleted (2% B.H. FDR) for at least 1 NP. All data were acquired in n = 3 independent assay replicates. Source data are provided as a Source Data file.

