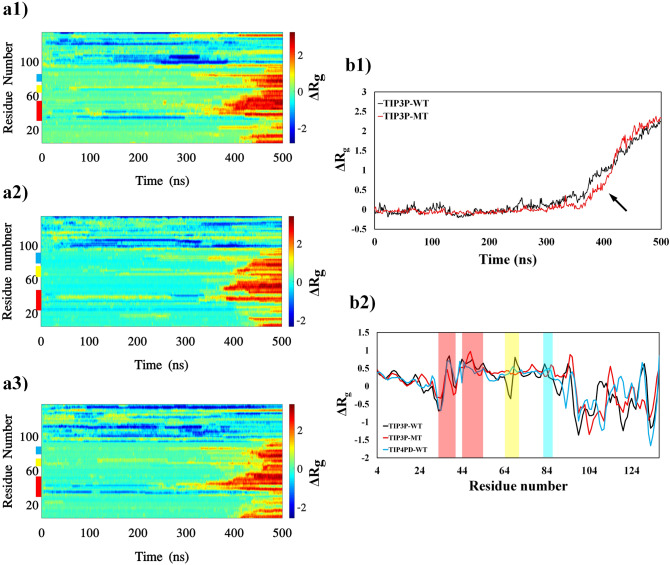
Figure 2.
The difference between gyration radius () of each frame configurations with the first frame during TMD trajectories. The figures in left panels show kymographs of three sets of the TMD simulations, protein wild type in TIP3P water model (TIP3P-WT), mutated protein in TIP3P water model (TIP3P-MT) and protein wild type in TIP4PD water model (TIP4PD-WT). Color bar in the right side indicates the values and the locations of the hot sites are colored as red, yellow and cyan in the left side of the plots indicating the first, second and third priorities, respectively. B1 compares the average for valine and alanine residues in the hot sites (see text) the black arrows point to the most different of between the valine and alanine residues. B2 compares time averaged of the residues for the three sets of the simulations.

