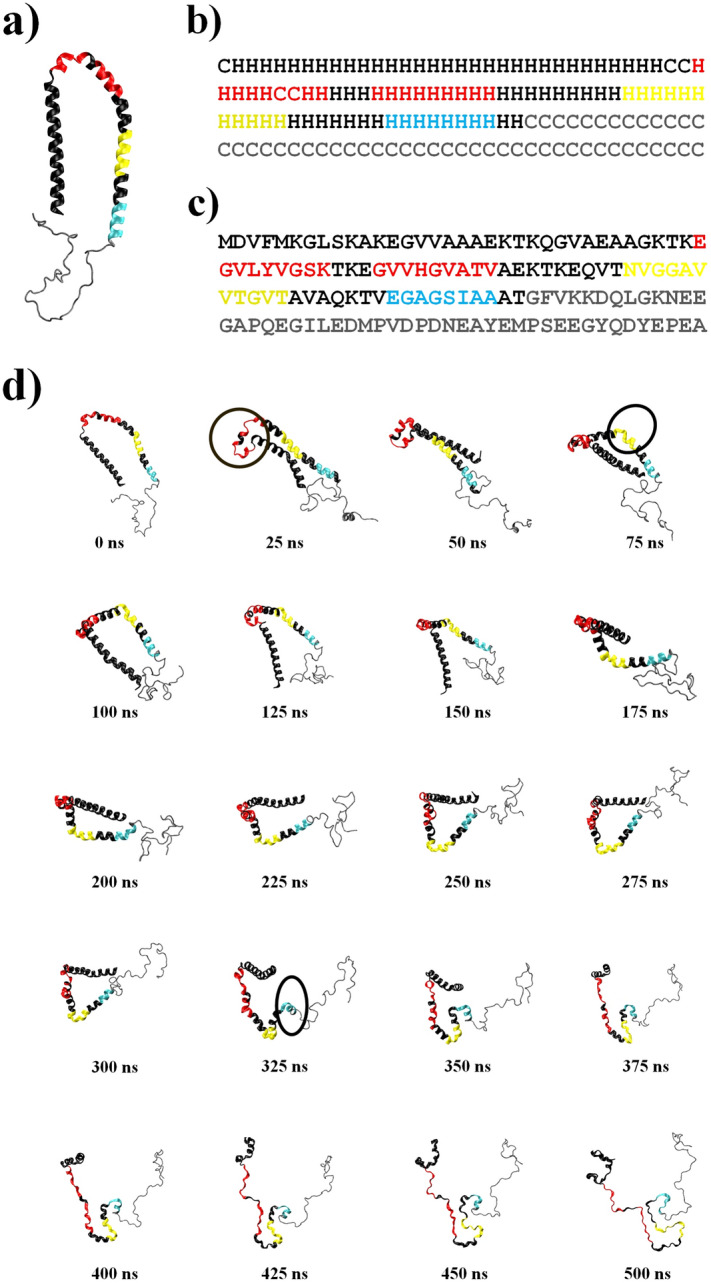
Figure 4.

Hot regions in tertiary (a), secondary (b) and primary (c) structures of αS. Red, yellow and cyan colors are indicated the first, second and third priorities of hot regions, respectively. The gray color corresponds to the disorder part of αS. (d) Snapshots of αS intervals of 25 ns. The first, second and third priorities of hot sites are indicated red, yellow and cyan, respectively. The significant changes for each region are identified by circles in 25, 75 and 325 ns, respectively. The gray color corresponds to the disorder part of αS. Each configuration provided by VMD version 1.9.327.
