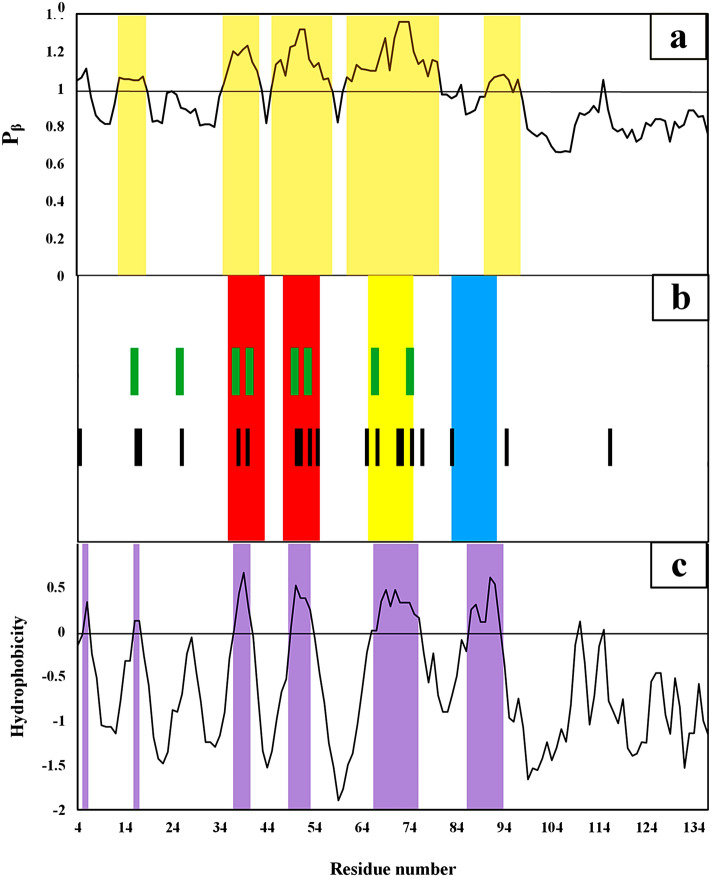
Figure 5.
Sequence-dependent properties of hot sites over the sliding window. (a) Shows the propensity values of the residues to the extended structures. The light brown color bands correspond to the chameleonic regions. The hot regions of αS are shown in (b) panel. The black lines show the location of valine residues while the green lines are the G–V sites, respectively. (c) Shows the hydrophobicity values of αS residues. The purple bands are related to the high hydrophobic sites along αS.

