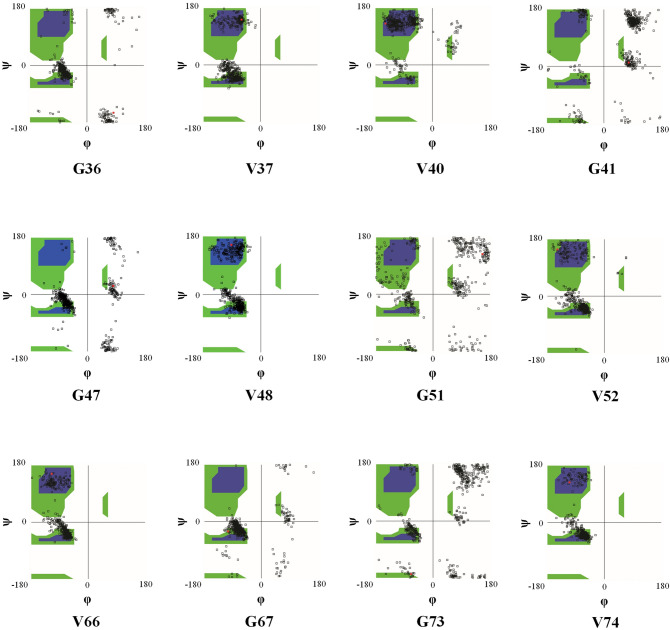
Figure 6.
The distributions of dihedral angle values of G–V sites during the simulation time in the space. The white regions are sterically disallowed for all amino acids except glycine. The blue regions correspond to the allowed regions namely the helix and extended conformations. The green areas show outer limit regions. The black points indicate the distribution of dihedral angle values of each residue during the simulation time.

