Fig. 2.

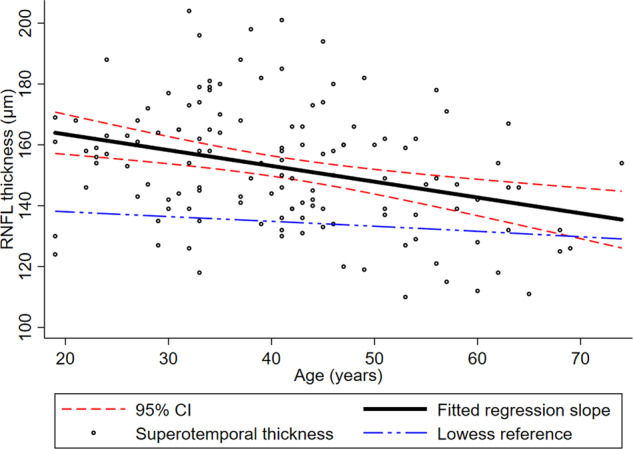
Composite graph of fitted regression slope with 95% confidence interval for superotemporal RNFL thickness vs age (thick black line straddled by two dashed lines), scatterplot of measured superotemporal RNFL thickness datapoints (hollow circles), and LOWESS curve of the reference database values (dash-dots line)
