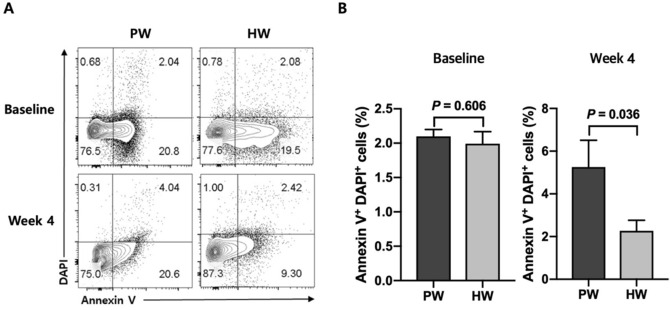
Figure 3.
Representative flow cytometric data (A) and frequencies of apoptotic cells (Annexin V+ DAPI+) at baseline and week 4 (B). Data are presented as means ± SEMs. Significant differences between PW group (n = 14) and HW group (n = 15) at baseline were determined with the use of an unpaired t test or a Mann–Whitney U test, and those at week 4 were determined with a general linear model adjusting for the value at baseline as a covariate. PW, plain water; HW, H2-rich water.

