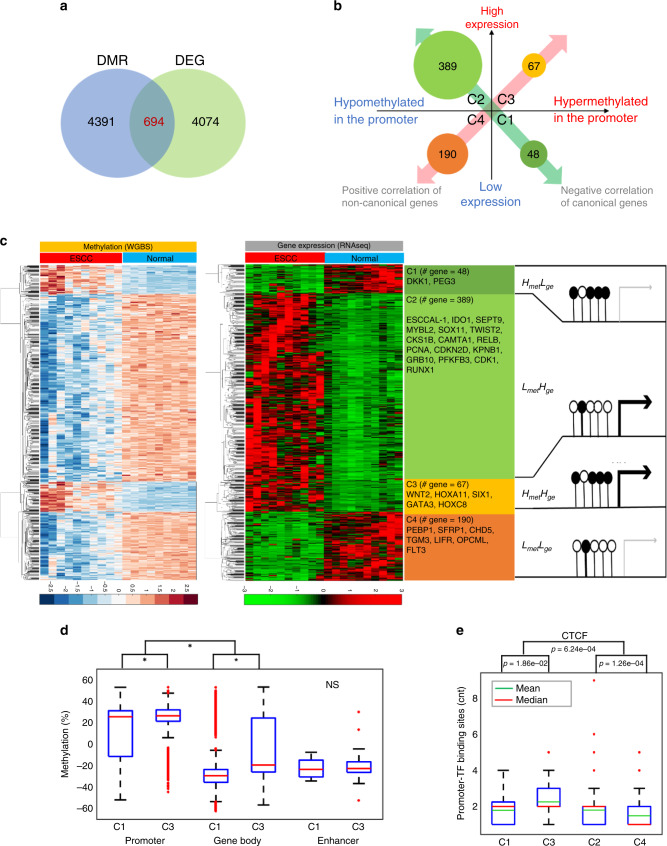
Fig. 3. Integrative analysis of WGBS and RNAseq uncovered methylation-mediated diverse gene regulation.
a A total of 694 genes were selected for the methylome–transcriptome association analysis. The selected genes have statistically significant DMRs (FDR ≤ 0.001) in promoters, defined as 4500 base pair (bp) upstream and 500 bp downstream relative to transcription start sites, and are statistically significant DEGs (differentially expressed genes) (|log2(fold change)| > 1, FDR ≤ 0.05). b, c The association of promoter methylation and expression of the 694 genes were identified. There are four clusters: C1 (n = 48): genes that are hypermethylated in the promoter with low expression level in ESCC; C2 (n = 389): genes that are hypomethylated in the promoter with high expression in ESCC; C3 (n = 67): genes that are hypermethylated in the promoter with high expression in ESCC; C4 (n = 190): genes that are hypomethylated in the promoter with low expression in ESCC. Genes in C1 and C2 fit the canonical model of regulation, while genes in C3 and C4 are not well explained by current understanding. Representative genes are listed in each cluster. See Supplementary Data File 4. d The quantification of CpG methylation in gene promoters and gene bodies in C3 (n = 67) is significantly higher than in C1 (n = 48), p < 0.001, while no significant difference (NS) for enhancers. e CTCF-binding sites are significantly higher in C3, indicating hypermethylation of inhibitors leads to de-repression to promote gene expression. The sample sizes for C1, C2, C3, and C4 in d and e are the same as defined in b and c. Box and whisker plot: center line, median or mean; box limits, upper and lower quartiles; and whiskers, maximum and minimum values, circle dots, outliers. Statistic significance was assessed by one-way ANOVA.

