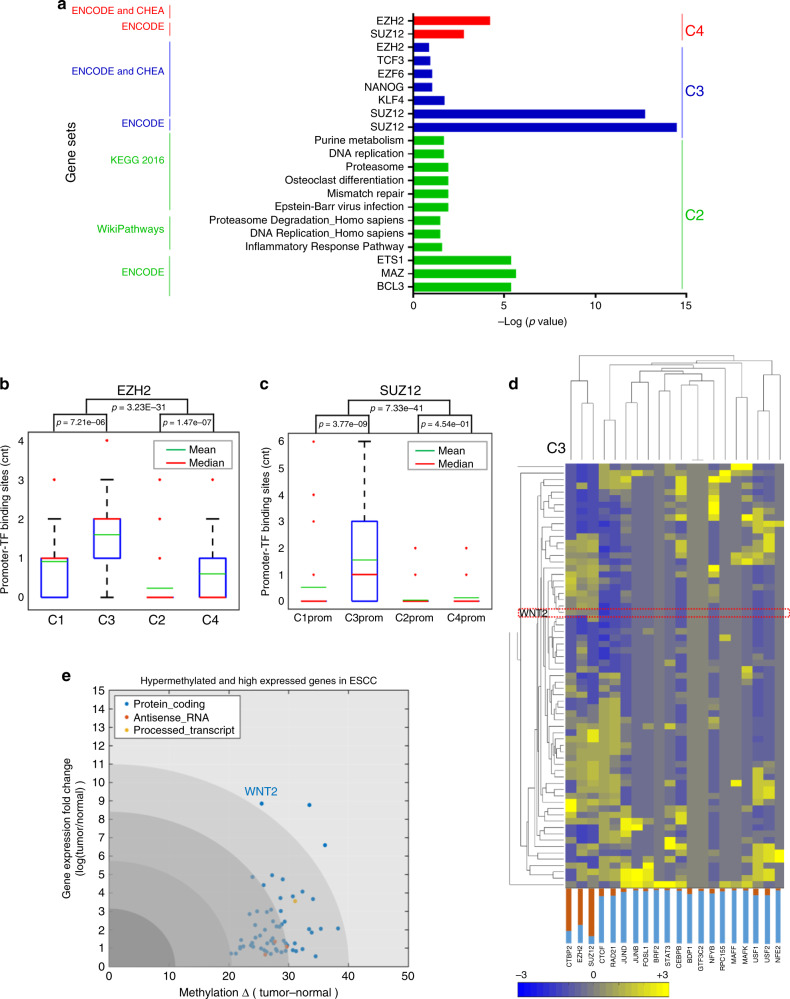
Fig. 4. DNA methylation at regulatory consensus protein-binding sites and impacts on gene expression.
a Functional annotation for the four distinct methylation-transcriptome clusters. Lists of genes in C2 (n = 389), C3 (n = 67), and C4 (n = 190) were subjected to gene set analysis using hypergeometric statistics for gene sets collected from multiple databases (ENCODE, CHEA, KEGG, WikiPathways, Reactome, GO molecular function, Panther, BIOGRID, etc.). The significance of the hypergeometric analysis is indicated as –Log10 (p value) in the form of a horizontal histogram where bar heights represent level of significance. Bars are color coded based on their inclusion in each cluster. Gene pathways or GO terms in different clusters, including polycomb repression complex 2 (PRC2) subunit, EZH2 (Ester of Zinc Finger Homolog 2), and SUZ12 (Polycomb Repressive Complex 2 Subunit)-binding sites significantly enriched in C3, suggesting hypermethylation of PRC2 de-represses gene expression. Genes in C1 have no significant gene set enrichment. b, c In silico analysis of EZH2 or SUZ12-binding sites within gene promoters in each cluster (C1–C4) and show more significant binding scores in C3 than in other groups, Box and whisker plot: center line, median (red) or mean (green); box limits, upper and lower quartiles; and whiskers, maximum and minimum values; red dots, outliers. Statistic significance was assessed by one-way ANOVA. d The probability of the top 20 transcription factor consensus-binding sites in C3 showed EZH2 has the highest binding scores in a subset of genes in C3, including WNT2. The heatmaps for C1, C2, and C4 are in Supplementary Fig. 18. e In non-canonical gene cluster C3 (n = 67), WNT2 is significantly hypermethylated in the promoter (one-way ANOVA, FDR = 6.6005e−03) and highly expressed in ESCC (one-way ANOVA, FDR = 0.0039). WNT2 also shows the highest fold change in gene expression in ESCC relative to adjacent normal tissues. Each dots represent individual gene; colored dots reflect different categories genes.

