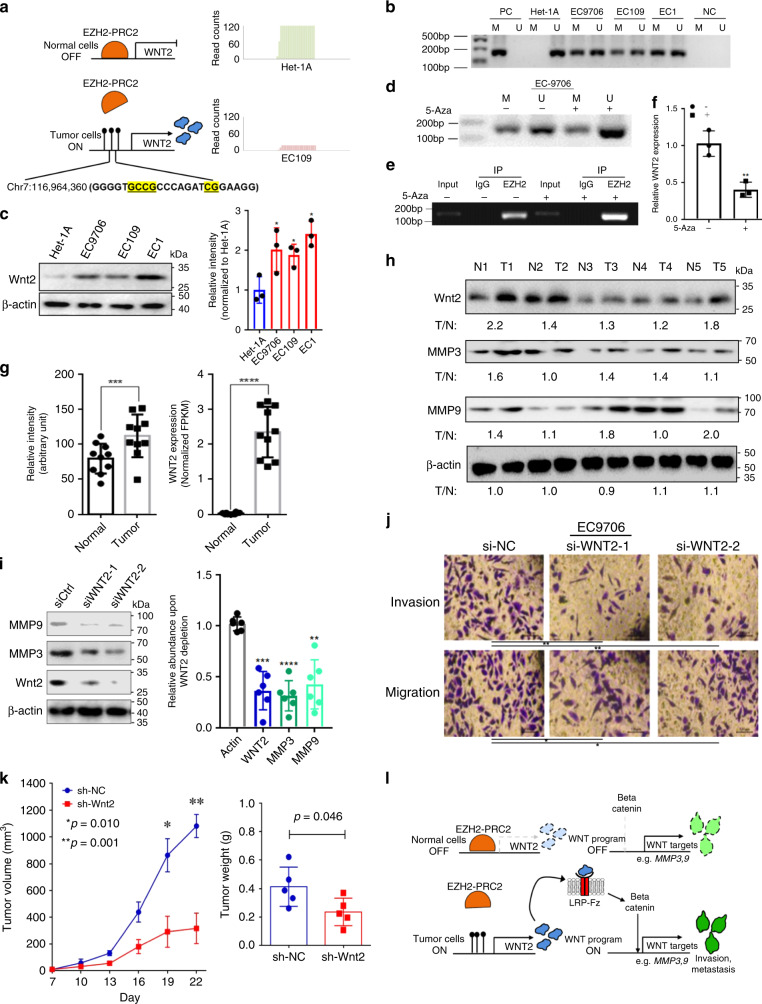
Fig. 5. Hypermethylation in the WNT2 promoter leads to high WNT2 expression in ESCC.
a Chromatin immunoprecipitation by high-throughput DNA sequencing (ChIP-seq) showed EZH2 preferentially binding to the hypomethylated WNT2 promoter region in normal cells (Het-1A) relative to the hypermethylated WNT2 promoter region in ESCC cells (EC109). b The WNT2 promoter region is hypermethylated in ESCC cell lines by methylation-specific PCR (MS-PCR) analysis. M methylation detection, U unmethylation detection, PC positive control, NC negative control. Het-1A cells are an immortalized normal esophageal epithelial cell line. EC9706, EC109, and EC1 are patient-derived ESCC cell lines. c Western blot analysis showed WNT2 protein is overexpressed in three ESCC cancer cell lines compared to normal cell line Het-1A. d EC9706 cancer cells were treated with or without the DNA methyltransferase inhibitor, 5-Azacytidine (5-AzaC), for 24 h. The methylation change status in promoter region of WNT2 was detected by MS-PCR. e ChIP-PCR detection of EZH2 pull-down in EC9706 cancer cells were treated with or without 5-AzaC for 24 h. f RT-PCR detection of WNT2 expression in EC9706 cancer cells were treated with or without 5-AzaC for 24 h. g WNT2 is overexpressed in ESCC tumor (n = 10) and adjacent normal samples (n = 10). Left panel: protein expression from western blots, right panel: RNA abundance (FPKM) from RNAseq. h WNT2, MMP3, and MMP9 expression in the tumor and normal samples. Representative blots from 10 paired normal and ESCC tumor samples. i WNT2 depletion with two independent siRNAs inhibited MMP3 and MMP9 expression in the ESCC cell line EC9706. j Two independent siRNAs to silence WNT2 expression reduced the invasion and migration of ESCC cells relative to siRNA controls. Scale bar:100 µm. k Xenograft tumor growth curve and tumor weight in EC9706 cells expressing either shRNA control (sh-NC, n = 5) or sh-Wnt2 (n = 5). l Schematic representation of the mechanism of EZH2/PRC2-WNT2-MMP signaling upregulation in ESCC. Functional study of WNT2 in EC109 cell line is presented in Supplementary Fig. 27. Representative results from three independent experiments are presented in b–e, j; triplicates in each condition are shown in f. The bar plots are plotted as mean ± s.d. Statistic significance was measured using two-sided t-test. *p < 0.05, **p < 0.01. ***p < 0.001, ****p < 0.0001. Source data are provided as a Source Data file.

