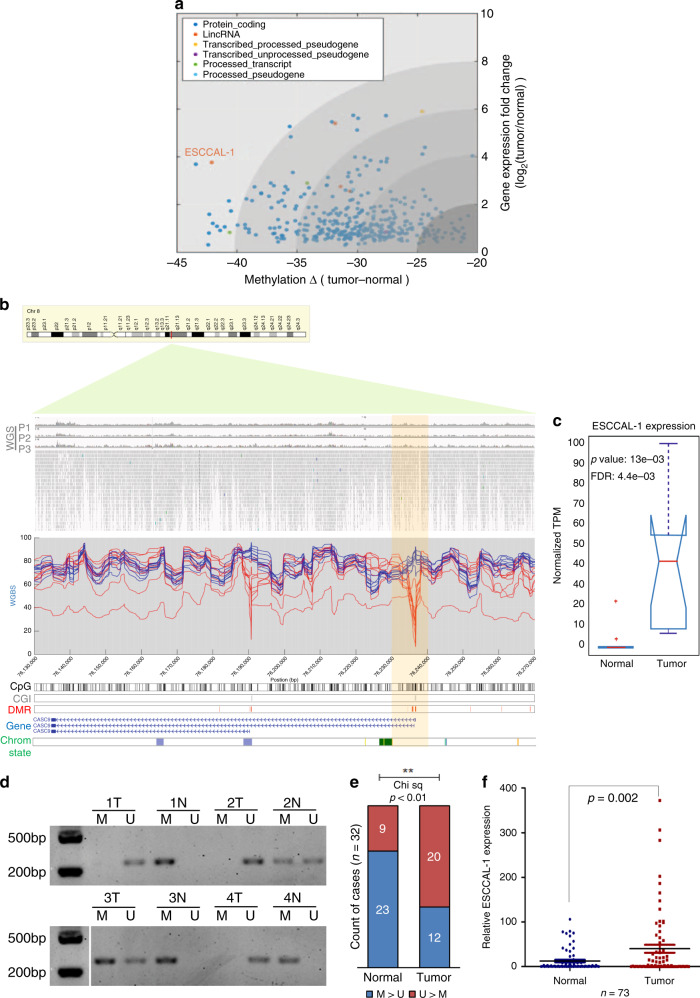
Fig. 6. Hypomethylation-mediated upregulation of long non-coding RNAs (lncRNAs) in ESCC.
a In canonical gene cluster C2 (n = 389), ESCCAL-1 is significantly hypomethylated in the promoter (one-way ANOVA, FDR = 1.7386e−04) and highly expressed in ESCC (one-way ANOVA, FDR = 0.01). ESCCAL-1 also shows the most significant and substantial methylation difference between normal esophageal tissues and ESCC among the lncRNAs in C2. Each dots represent individual gene; colored dots reflect different categories genes. b Loss of CpG methylation at the ESCCAL-1 promoter region in ESCC (chr8:76,135,639–76,236,976 of GRCh37/hg19). WGS (whole-genome sequencing) of three ESCC patients shows no mutation or copy number variations detected at the above indicated region. This is validated by TCGA ESCA data (n = 186), where no mutation or copy number variations were observed (see Supplementary Fig. 24d). DMRs around transcription start sites (TSSs) of the two isoforms showed extensive differentiation between ESCC and normal samples. c ESCCAL-1 was significantly differentially expressed and highly abundant in ESCC samples (n = 10) relative to normal samples (n = 10). Statistic significance was assessed by one-way ANOVA, p value = 0.0013, log2 (fold change) >1, FDR = 0.0044. d Methylation status of the ESCCAL-1 promoter region was verified on an independent matched normal (n = 32) and ESCC tumor (n = 32) samples using a methylation-specific PCR (MS-PCR) assay; four representative PCR results are shown. M: PCR with methylation primers, U: PCR with unmethylation primers. e Quantification of MS-PCR results in the 32 paired normal and tumor samples. Chi square analysis tested for significance between groups. P value < 0.01. f ESCCAL-1 expression is significantly higher in ESCC tumors in an independent cohort of 73 matched normal and tumor samples. Error bars are median values with 95% confidence intervals. Significance for comparison between the two cohorts was measured using an unpaired two-sided Student’s t-test, p = 0.002.

